article thumbnail

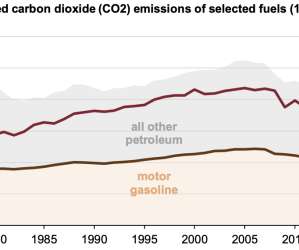
EIA: CO2 emissions from US power sector have declined 28% since 2005

Green Car Congress

US electric power sector CO 2 emissions have declined 28% since 2005 because of slower electricity demand growth and changes in the mix of fuels used to generate electricity, according to the US Energy Information Administration (EIA). Source: US EIA, US Energy-Related Carbon Dioxide Emissions , 2017.

2005 414
article thumbnail

California 2017 GHG inventory shows 1.2% total drop from 2016; transportation sector emissions up 1%

Green Car Congress

The California Air Resources Board’s latest state inventory of greenhouse gas emissions shows that California’s GHG emissions continue to decrease. Trends in California GHG Emissions. Changes in emissions by Scoping Plan sector between 2000 and 2017. Emissions are organized by the categories in the AB 32 Scoping Plan.

2017 230
article thumbnail

EIA: US energy-related CO2 fell by 2.8% in 2019, slightly below 2017 levels

Green Car Congress

US energy-related CO 2 emissions declined by 2.8% CO 2 emissions had increased by 2.9% Because of continuing trends in how much energy the US economy uses and how much CO 2 that energy use generates, energy-related CO 2 emissions in 2019 fell more than energy consumption, which declined by 0.9%

2019 273
article thumbnail

Technical brief: transportation overtaking electricity generation as the largest source of US CO2 emissions

Green Car Congress

The average rate at which CO 2 is emitted from vehicle tailpipes and other mobile sources has exceeded the rate of CO 2 emissions from electric power plants over seven of the past eight months. CO 2 emissions from the transportation sector increased at an average rate of 1.8% per year over the past four years. Data derived from US EIA.

article thumbnail

EU greenhouse gas emissions from transport increased for the second year in a row in 2015; on-road up 1.6%

Green Car Congress

Total European Union greenhouse gas emissions increased by 0.5% Higher emissions were caused mainly by increasing road transport, both passenger and freight, and slightly colder winter conditions in Europe, compared to 2014, leading to higher demand for heating. GHG emissions by aggregated sector in the EU-28 (kt CO 2 eq.).

2015 150
article thumbnail

University of Calgary Study Finds Large-Scale Adoption of PHEVs in Alberta Could Support Wind Power; PHEV GHG Benefits Range from 40-90% in Emissions Reduction

Green Car Congress

The study found the environmental impacts of PHEVs in Alberta would depend on factors such as vehicle battery size, charging time and wind production levels. Of the installed capacity of just above 12,000 MW, approximately 49% (5,893 MW) is coal fired, 39% (4,686 MW) is gas-fired, 7% (869 MW) is hydro, and 4% (497 MW) is wind powered.

PHEV 170
article thumbnail

Global Wind Power Capacity Grew 28.8% in 2008; 120.8 GW Total

Green Car Congress

Global wind energy capacity grew by 28.8% GW at the end of 2008, according to the Global Wind Energy Council. More than 27 GW of new wind power generation capacity came online in 2008, 36% more than in 2007. New US wind energy installations totalled 8,358 MW for a total installed capacity of 25,170 MW.

2008 150