This site uses cookies to improve your experience. To help us insure we adhere to various privacy regulations, please select your country/region of residence. If you do not select a country, we will assume you are from the United States. Select your Cookie Settings or view our Privacy Policy and Terms of Use.
Cookie Settings
Cookies and similar technologies are used on this website for proper function of the website, for tracking performance analytics and for marketing purposes. We and some of our third-party providers may use cookie data for various purposes. Please review the cookie settings below and choose your preference.
Used for the proper function of the website
Used for monitoring website traffic and interactions
Cookie Settings
Cookies and similar technologies are used on this website for proper function of the website, for tracking performance analytics and for marketing purposes. We and some of our third-party providers may use cookie data for various purposes. Please review the cookie settings below and choose your preference.
Strictly Necessary: Used for the proper function of the website
Performance/Analytics: Used for monitoring website traffic and interactions
A study by researchers at the University of Nottingham (UK) found a statistically significant association between acute respiratory infection (ARI) and bus or tram use in the five days before symptom onset. The risk appeared greatest among occasional bus or tram users, but this trend was not statistically significant.
General Motors partnered with the University of Michigan Transportation Research Institute to understand the real-world effectiveness of some of its available active safety, driver assistance, and advanced headlighting features that may prevent or mitigate different types of crashes.
Demonstrating that the use of different time scales, reference dates, and statistical approaches can generate highly disparate results in climate reports, scientists at the University of Alaska Anchorage argue that careful use of these tools is critical for correctly interpreting and reporting climatic trends in Alaska and other polar regions.
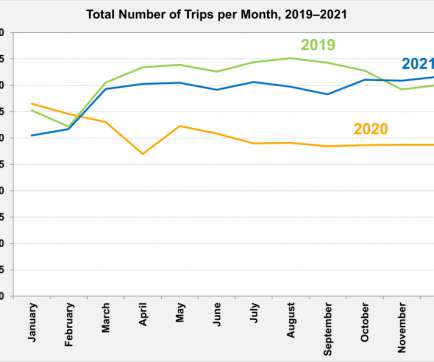
A research study for the Bureau of Transportation Statistics focused on the number of daily trips taken in the United States. Source: Estimated for the Bureau of Transportation Statistics by the Maryland Transportation Institute and Center for Advanced Transportation Technology Laboratory at the University of Maryland.
The US Department of Energy has selected 7 projects to participate in the University Coal Research (UCR) program. University of California, Merced, Calif. Carnegie Mellon University, Pittsburgh, Pa. University of Missouri, Kansas City, Mo. Clemson University, Clemson, S.C. DOE award: $298,191).
Those estimates are based on a series of papers by University of Wisconsin and Iowa State University economists Xiaodong Du and Dermot Hayes, who used monthly regional data to estimate the relationship between ethanol production and the pro?t and statistically insignificant. in 2010 and 2011, respectively. The paper by Prof.
However, the starting year of this analysis is 1966 because (1) for 1923 through 1935, fuel-economy information is available only for the entire fleet of all vehicles, and (2) from 1936 through 1965, light trucks were included with other trucks in the relevant statistics.?. Annual statistics from the U.S. Department of Transportation.
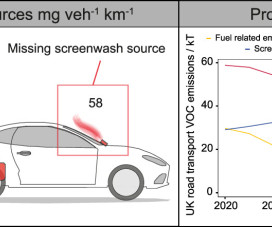
In a recent open-access paper published in ACS’ Environmental Science & Technology , researchers from the University of York report that alcohols in windshield washer fluid account for a larger fraction of real-world vehicle emissions than previous estimates have suggested. the products used for “car care,” such as windshield washer fluid.
Bureau of Transportation Statistics.) Michael Sivak is the managing director of Sivak Applied Research and the former director of Sustainable Worldwide Transportation at the University of Michigan. The raw data came from the U.S. Department of Transportation and the U.S. The results are shown in the table below.
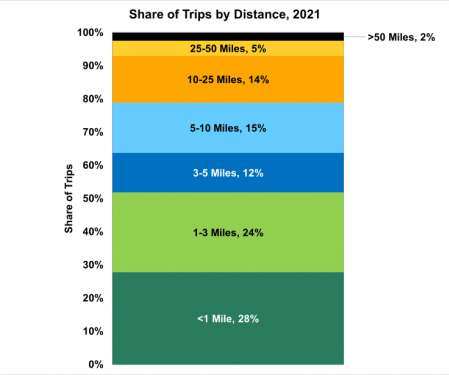
Recent data from the Bureau of Transportation Statistics presented by the US Department of Energy (DOE) showed that in November of 2021, the number of daily trips taken nationwide exceeded the number of trips taken in late 2019, before the pandemic significantly affected daily travel across the United States.
However, the starting year of this analysis is 1966 because (1) for 1923 through 1935, fuel-economy information is available only for the entire fleet of all vehicles, and (2) from 1936 through 1965, light trucks were included with other trucks in the relevant statistics.?. Annual statistics from the U.S. Department of Transportation.
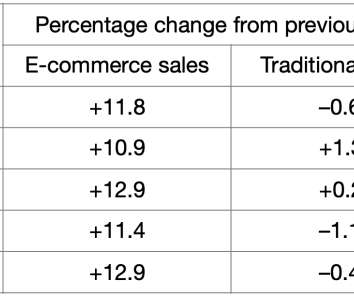
Bureau of Labor Statistics. Given the sizes of the standard errors, none of the three variables of interest showed a statistically significant difference between 2007 and 2017. This analysis examined whether one can discern any influence of the growth of e-commerce on the amount of travel. ATUS is an annual time-diary study by the U.S.
The calculated average passenger-distances traveled per person are shown in the table below, along with the average occupancy rates from the Bureau of Transportation Statistics. Michael Sivak is the managing director of Sivak Applied Research and the former director of Sustainable Worldwide Transportation at the University of Michigan.
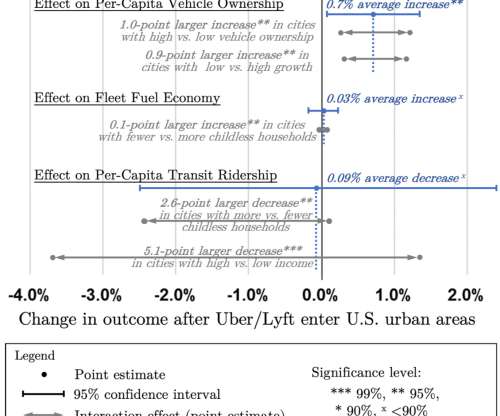
on average, increasing even more in car-dependent cities, according to a new study led by researchers at Carnegie Mellon University. Sloan Foundation, the US Department of Energy, and Carnegie Mellon University. When ridesourcing companies Uber and Lyft show up in urban areas, vehicle registrations per capita increase by 0.7%
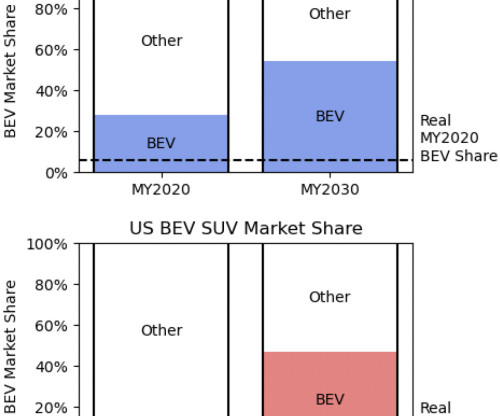
A study by a team from Carnegie Mellon University and Yale University suggests that BEVs could constitute the majority or near-majority of cars and SUVs by 2030, given widespread BEV availability and technology trends. Their open-access paper is published in Proceedings of the National Academy of Sciences (PNAS).
Gasoline consumption per capita was calculated using the population estimates in the ProQuest Statistical Abstract of the United States. Michael Sivak is the managing director of Sivak Applied Research and the former director of Sustainable Worldwide Transportation at the University of Michigan. Consumption per capita.
The paper by researchers from Peking University and Environment Canada appears in the ACS journal Environmental Science & Technology. For the remaining sources, the following fuel consumption data were used: national data from the United Nations Statistics Division (1949?1970); 2007 were used in this study. —Wang et al.
The Colorado State University forecast team predicts an above-average 2010 Atlantic basin hurricane season based on the premise that El Niño conditions will dissipate by this summer and that anomalously warm tropical Atlantic sea surface temperatures will persist. The team began using a new early April statistical model in 2008.
A team at the University of Nebraska-Lincoln has investigated the long-term adaptability and economic feasibility of non-flex-fuel vehicles—vehicles designed to use fuel blends containing 85% ethanol (E85) or less—to consume a 30% ethanol (E30) fuel blend.
A new statistical method developed by researchers at KAUST (King Abdullah University of Science and Technology, Saudi Arabia) can detect abnormal ozone levels within large bodies of monitored data.
Our scheme is hybridizing two different quantum technologies, says Jacob Dunningham , professor of physics at the University of Sussex in the United Kingdom. Last month, a team of researchers at Guangxi University in Guangxi, China reported they confirmed the SQRS protocol works, at least at a proof-of-principle level.
Conversion of large swaths of Brazilian land for sugar plantations will help the country meet its needs for producing cane-derived ethanol, but it also could lead to regional climate effects, according to a team of researchers from Arizona State University, Stanford University and the Carnegie Institution for Science. Resources.
Accompanying the lower noise levels from bus traffic was a reduction of fatigue, day time sleepiness and low mood, a study at the University of Gothenburg shows. The changes that took place between phases one and two were clear and statistically significant. Even small increases in its level are perceived as very noticeable.
The Axeon-led project, which looks into the economic viability of automotive battery recycling in the UK, involves Oxford Brookes University as a partner. Axeon will also develop a thorough and statistically-robust process for determining when batteries have reached their end of life and are ready to be recycled.
Long-term exposure to ambient ozone appears to accelerate arterial conditions that progress into cardiovascular disease and stroke, according to a new University at Buffalo study. We used statistical models to capture whether there are significant associations between ozone exposure and these outcomes. —Meng Wang.
Enhancements have been made in the areas of statistics, optimization, linear algebra, ordinary differential equations, regression, random numbers, sorting, and special functions. A new sub-chapter has also been introduced on option pricing.
Researchers at Stanford University and SLAC National Accelerator Laboratory now report that the root cause of lithium intrusion into the electrolyte is a combination of current focusing and the presence of nanoscale cracks, rather than electronic leakage or electrochemical reduction. Yet others theorize different forces are at play.
A new study published in Nature Communications by researchers from IIASA, Boston University, and the Ca’ Foscari University of Venice found that by mid-century, climate change will increase the demand for energy globally, even with modest warming. —coauthor Ian Sue Wing, a researcher at Boston University.
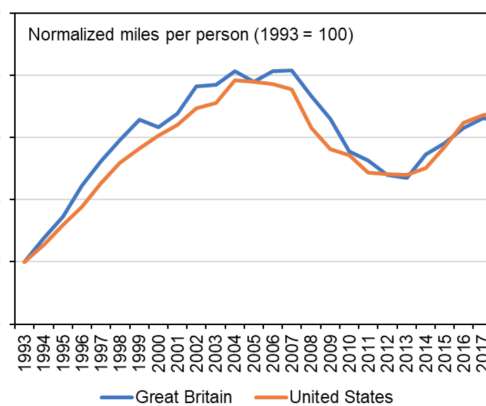
statistics segment road vehicles differently, the data are for all road vehicles. (I Office for National Statistics (populations). Michael Sivak is the managing director of Sivak Applied Research and the former director of Sustainable Worldwide Transportation at the University of Michigan. Because British and U.S.
The study was performed by a team from the University of California at Riverside (UCR) Bourns College of Engineering – Center for Environmental Research and Technology (CE-CERT). The test fleet showed statistically significant effects for some pollutants, but not for others.
Extreme value theory , used in science, engineering, insurance and risk management, provides a theoretical foundation for building statistical models describing extreme events. The research team noted that statistical observations offer complementary insights compared to the current generation of physics-based computational models.
the E30 and E78—led to statistically significant reductions of 9%–13% for total hydrocarbon (THC); 13%–44% for non-methane hydrocarbon (NMHC); 20%–35% for carbon monoxide (CO); and 17%–36% for nitrogen oxides (NO x ) emissions compared to the high-aromatics E10 fuel. The study found that higher ethanol blends—i.e.,
Source: University of Leicester. Statistical analysis was carried out on the data, in order to calculate peak and high ozone levels and to interpret trends and changes in the data. TOAR has created a large publicly available database which also includes a complete set of statistics and graphical downloads. Click to enlarge.
All data are from the Bureau of Transportation Statistics , except that the entry for 2020 is an estimate from the Energy Information Administration. Michael Sivak is the managing director of Sivak Applied Research and the former director of Sustainable Worldwide Transportation at the University of Michigan. certificated air carriers.
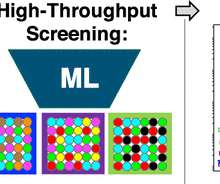
Data-driven materials’ discovery paradigms provide an alternative to traditional approaches, whereby machine/statistical learning (ML) models are used to efficiently screen materials for desired properties and significantly narrow the scope of expensive/time-consuming first-principles modeling and experimental validation.
We consider four key pieces of evidence to support this finding: (i) energy and chemical production statistics; (ii) near-roadway measurements of transportation emissions, together with laboratory testing of chemical products; (iii) ambient air measurements away from roads; and (iv) indoor air measurements. McDonald, Joost A. Cappa, Jose L.
The sample was homogenized by cone-and-quarter methods and pulverized to 100 mesh to obtain a statistically repetitive sample. Mineral processing was carried out at the University of Nevada, Reno’s Ore Dressing Laboratory. The claystone is responsive to dilute acid leaching as well as several methods of selective lithium leaching.
Researchers at the University of Waterloo examined data from 28 million trips for possible links between four bad driving behaviors—speeding, hard braking, hard acceleration and hard cornering—and the likelihood of crashes. —Stefan Steiner, a statistics professor in Waterloo’s Faculty of Mathematics.
The authors are from Harvard University; Carnegie Institution for Science; University of Michigan; National Oceanic and Atmospheric Administration; Lawrence Berkeley National Laboratory; Atmospheric and Environmental Research; European Commission Joint Research Centre; and University of Colorado Boulder. Miller, Steven C.
Bureau of the Census (e-commerce and traditional retail sales), Proquest (population), and the Bureau of Labor Statistics (Consumer Price Index). Michael Sivak is the managing director of Sivak Applied Research and the former director of Sustainable Worldwide Transportation at the University of Michigan.
Among the findings were: The average NO emissions were higher at a statistically significant level for the B20 and higher biodiesel blends compared to the CARB diesel for all the test cycle/engine combinations, with the exception of the animal-based biodiesel on the UDDS cycle for the 2006 Cummins engine. Credit: ACS, Hajbabaei et al.
In this plot, a red star under the boxes means that the mean values for hardwood and mixed fuel tests are statistically different for that stove technology class (at the 95% confidence level, p. In this regard, this study highlights the need for repeated tests to confirm statistical significance of mitigation potential.
Replacing a gasoline-powered ride-hailing vehicle with an electric vehicle can deliver three times the carbon benefits of a personally owned electric vehicle, according to a study by a University of California, Davis, researcher of Uber and Lyft data. The paper is published in the journal Nature Energy. Nat Energy (2020).
Researchers from MIT, Northeastern University and Italy’s University of Padua have identified an underlying flaw in the “gravity law”—a statistical formula used in modeling the movement of people and goods between cities, states or countries. states and major metropolitan areas. states and major metropolitan areas.
We organize all of the trending information in your field so you don't have to. Join 5,000+ users and stay up to date on the latest articles your peers are reading.
You know about us, now we want to get to know you!
Let's personalize your content
Let's get even more personalized
We recognize your account from another site in our network, please click 'Send Email' below to continue with verifying your account and setting a password.


Let's personalize your content