article thumbnail

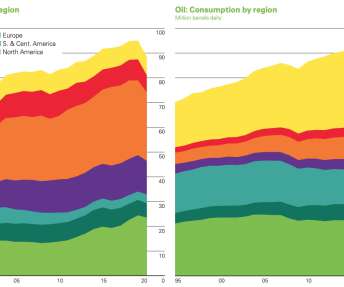
bp Statistical Review shows 4.5% drop in primary energy consumption in 2020; mainly driven by oil

Green Car Congress

bp released the 70 th annual edition of the bp Statistical Review of World Energy ; the data collected in this year’s edition includes energy data for 2020. The Review captures the significant impact the global pandemic had on energy markets and how it may shape future global energy trends.

Oil 388
article thumbnail

The New bp Statistical Review of World Energy — What Does It Mean?

CleanTechnica EVs

The bp Statistical Review of World Energy is a venerable survey of the world’s energy production and consumption — the oil giant has been publishing it yearly since 1952. It’s an extremely detailed report — it lists the amounts of energy generated and consumed, as well as the means of generation, for just about every country […].

Energy 122
Insiders

Sign Up for our Newsletter

This site is protected by reCAPTCHA and the Google Privacy Policy and Terms of Service apply.

Trending Sources

article thumbnail

Georgia Tech team develops AI to read EV charging station reviews to find infrastructure gaps

Green Car Congress

Predicted discussion frequency of station availability for US metropolitan and micropolitan statistical areas. The map reveals areas with high and low discussion frequency for predicted Availability issues in all metropolitan statistical areas (e.g., Micropolitan statistical areas (e.g., population greater than 50,000).

Georgia 545
article thumbnail

CARB releases results of multi-year E15 study; multiple air quality benefits with slight reduction in fuel economy

Green Car Congress

The test fleet showed statistically significant effects for some pollutants, but not for others. NO x emissions, a target pollutant of concern for this program, did not show any statistically significant difference between the fuels for the FTP nor for each individual FTP phase.

article thumbnail

More than half of all daily trips in US were less than three miles in 2021

Green Car Congress

A research study for the Bureau of Transportation Statistics focused on the number of daily trips taken in the United States. Source: Estimated for the Bureau of Transportation Statistics by the Maryland Transportation Institute and Center for Advanced Transportation Technology Laboratory at the University of Maryland.

Miles 242
article thumbnail

Volvo Trucks had 42% market share of heavy-duty electric trucks in Europe in 2021

Green Car Congress

New statistics show that Volvo Trucks was the market leader for heavy all-electric trucks in Europe 2021 with a market share of 42%. Statistics from the market analysis group IHS Markit show that during 2021 a total of 346 electric trucks (?16 An increasing number of heavy all-electric trucks are now running in commercial traffic.

Volvo 436
article thumbnail

How safe is Tesla Autopilot? Parsing the statistics (as suggested by Elon Musk)

Green Car Reports

One of the tools Elon Musk and Tesla Motors have used to defend the safety of its Autopilot software is the dark and perplexing art of statistics. After a fatal Autopilot-related crash in May, a company blog post pointed out that the crash was “the first known fatality in just over 130 million miles where Autopilot was activated.”

article thumbnail

New statistical method to detect ozone pollution hot spots and monitor instrument failure; combining PCA and MEWMA

Green Car Congress

A new statistical method developed by researchers at KAUST (King Abdullah University of Science and Technology, Saudi Arabia) can detect abnormal ozone levels within large bodies of monitored data. The monitoring methods can quickly and accurately detect ozone anomalies—localized spikes in ozone concentration indicated by sensor data.

Ozone 212
article thumbnail

DOE: number of daily trips taken by Americans in 2021 rebounded from 2020 lows

Green Car Congress

Recent data from the Bureau of Transportation Statistics presented by the US Department of Energy (DOE) showed that in November of 2021, the number of daily trips taken nationwide exceeded the number of trips taken in late 2019, before the pandemic significantly affected daily travel across the United States.

2020 242
article thumbnail

Monthly changes in key transportation indexes

Green Car Congress

Bureau of Transportation Statistics (revenue passenger miles). Bureau of Labor Statistics (Consumer Price Index). Energy Information Administration (price of gasoline). Federal Highway Administration (vehicle miles traveled). Census Bureau (population).

article thumbnail

Refineries in the Americas produce a greater share of gasoline per barrel of crude oil than refineries in other world regions

Green Car Congress

The International Energy Agency’s Monthly Oil Statistics shows that there are differences in refinery output throughout the world. Source: International Energy Agency, Monthly Oil Statistics, February 2020, Paris, France., When processing petroleum, refineries can produce products in varying amounts to meet regional demands.

Gasoline 403
article thumbnail

ABTC inferred resources report finds Tonopah Flats may hold 15.8 million tons lithium carbonate equivalent

Green Car Congress

The sample was homogenized by cone-and-quarter methods and pulverized to 100 mesh to obtain a statistically repetitive sample. Through this analysis an open-pit resource estimate was developed that would support a processing rate of at least 200,000 tons of claystone per day.

Carbon 242
article thumbnail

Statistically, Tesla Car Fires Are Less And Less Frequent

InsideEVs

The company reports that fire incidents are 11x lower for Tesla vehicles than the average vehicle in the US.

Tesla 131
article thumbnail

Tesla Autopilot statistics, renewable energy growth, 2017 Nissan Versa Note: Today's Car News

Green Car Reports

A look at Tesla's own statistics shows that Autopilot has a higher crash rate than human. Today, we take a close look at Tesla Autopilot crash data, the Department of Energy indicates U.S. renewable energy use will grow in 2017, and the 2017 Nissan Versa Note appears ahead of the 2016 Detroit Auto Show.

Nissan 110
article thumbnail

All Your Tesla Supercharger Network Statistic Questions Answered

InsideEVs

Did you know that 68.7 percent of all Supercharger stations are located in the United States and China?

Tesla 125
article thumbnail

Want To Electrify Everything? Train More Electricians — Quickly

CleanTechnica EVs

The US Bureau of Labor Statistics projects growth of electrician jobs will increase by 9.1% from 2020 to 2030.

2020 129
article thumbnail

Scientists call for careful use of time scales, reference dates and statistical approaches in analyzing climate change trends to avoid distortion and hampering of response

Green Car Congress

Demonstrating that the use of different time scales, reference dates, and statistical approaches can generate highly disparate results in climate reports, scientists at the University of Alaska Anchorage argue that careful use of these tools is critical for correctly interpreting and reporting climatic trends in Alaska and other polar regions.

article thumbnail

Exploratory study finds statistically significant association between acute respiratory infection and bus or tram use

Green Car Congress

A study by researchers at the University of Nottingham (UK) found a statistically significant association between acute respiratory infection (ARI) and bus or tram use in the five days before symptom onset. The risk appeared greatest among occasional bus or tram users, but this trend was not statistically significant.

2008 196
article thumbnail

Two-thirds of freight shipped by truck in the US in 2018 was shipped less than 100 miles

Green Car Congress

Source: US Department of Transportation, Bureau of Transportation Statistics and Federal Highway Administration, Freight Analysis Framework, version 4.5.1, billion tons were shipped between 100 and 249 miles and 1.2 billion tons between 250 and 499 miles.

Miles 385
article thumbnail

Tesla No Longer Includes Charging Equipment With Vehicles; Cites Statistics

InsideEVs

The move will leave new buyers without a way to recharge at home

Recharge 112
article thumbnail

GM announces Ultra Cruise: hands-free driving across 95% of driving scenarios for premium vehicles

Green Car Congress

Ultra Cruise works through a combination of cameras, radars and LiDAR, developing accurate, 360-degree, three-dimensional statistical representations of the environment surrounding vehicles with redundancies in critical areas. The app will provide more centrally located information, including driver’s statistics, trips and history.

Vehicles 387
article thumbnail

Monthly changes in key transportation indexes

Green Car Congress

Bureau of Transportation Statistics (revenue passenger miles). Bureau of Labor Statistics (Consumer Price Index). Energy Information Administration (price of gasoline). Federal Highway Administration (vehicle miles traveled). Census Bureau (population).

article thumbnail

Actual fuel economy of cars and light trucks: 1966-2019

Green Car Congress

However, the starting year of this analysis is 1966 because (1) for 1923 through 1935, fuel-economy information is available only for the entire fleet of all vehicles, and (2) from 1936 through 1965, light trucks were included with other trucks in the relevant statistics.?. Annual statistics from the U.S. Department of Transportation.

article thumbnail

NHTSA estimates roadway fatalities beginning to level off after two years of increases

Green Car Congress

The US Department of Transportation’s (DOT) National Highway Traffic Safety Administration (NHTSA) released its latest statistical projections for traffic fatalities in 2022, estimating that 31,785 people died in traffic crashes in the first nine months of the year. This represents a marginal 0.2%

article thumbnail

Stanford team identifies root cause of lithium intrusion into solid electrolytes

Green Car Congress

In this work, the researchers investigated statistically the effect of locally and globally applied stress on lithium penetration initiation in Li 6.6 Some say the unintended flow of electrons is to blame, while others point to chemistry. Yet others theorize different forces are at play. La 3 Ta 0.4

Li-ion 438
article thumbnail

Average annual highway vehicle miles traveled per capita varies by state

Green Car Congress

Department of Transportation, Federal Highway Administration, Highway Statistics 2017, August 2018, Table VM-2. Note: Highway vehicle VMT includes all vehicle travel on highways, streets, and local roads. Values rounded to the nearest hundred miles. Sources: VMT – U.S. Resident population – U.S.

Miles 338
article thumbnail

Does e-commerce affect the amount of travel in the United States?

Green Car Congress

Bureau of Labor Statistics. Given the sizes of the standard errors, none of the three variables of interest showed a statistically significant difference between 2007 and 2017. This analysis examined whether one can discern any influence of the growth of e-commerce on the amount of travel. ATUS is an annual time-diary study by the U.S.

article thumbnail

ORNL researchers use blockchain to increase electric grid resiliency; Grid Guard

Green Car Congress

The data and equipment settings are constantly verified against a statistical baseline of normal voltage, frequency, breaker status and power quality. The approach uses tamper-resistant blockchain to spread configuration and operational data redundantly across multiple servers. Grid Guard attestation framework and Anomaly Detection Module.

Grid 482
article thumbnail

EIA: China processed record amounts of crude oil in 2021 but exported less gasoline and diesel

Green Car Congress

According to China’s National Bureau of Statistics, China processed a record 14 million barrels per day (b/d) of crude oil in 2021, a 4.6% Source: Graph by the U.S. Energy Information Administration, based on data from China General Administration of Customs, as compiled by Bloomberg, L.P. increase from 2020.

Gasoline 370
article thumbnail

Safety of flying and driving after the attacks of 9/11 revisited

Green Car Congress

Bureau of Transportation Statistics.) Specifically, of interest here is the number of fatalities in each of the two transportation modes during a 10-year period from 2010 through 2019. The raw data came from the U.S. Department of Transportation and the U.S. The results are shown in the table below.

2010 375
article thumbnail

2020 Audi A8 TFSI e plug-in hybrid carries starting price of $94,000

Green Car Congress

The plug-in hybrid receives an MMI display with electric-specific driving screens, including charging information, and additional consumption statistics to help drivers maximize the efficiencies of the hybrid system. The Audi virtual cockpit is also updated to display battery data and range statistics.

Audi 314
article thumbnail

100 Best Selling BEVs in 10 European Countries

CleanTechnica EVs

By Maarten Vinkhuyzen and Zach Shahan Because we never have enough statistics, here’s another list of top selling electric vehicles — this one showing the 100 best selling BEVs in 10 European countries (combined) in 2022. We thought it would be a bit fun to look deeper down the roster of popular (or semi-popular) European […].

article thumbnail

UNL study finds non-flex fuel vehicles can adapt to E30 gasoline without performance compromise; fuel efficiency comparable to E15

Green Car Congress

They used statistical and data analysis methods including sparse regression and neural networks to compare the behavior of these parameters temporally and between the two fuel types. Among their findings: Although differences in the performance metrics were statistically significant, the magnitude of these differences were minimal.

Fuel 365
article thumbnail

Volvo Trucks starts series production of heavy-duty electric trucks

Green Car Congress

Volvo Trucks’ electric portfolio could cover around 45% of all goods transported in Europe today, according to Eurostat statistics. The demand for electric trucks is rapidly increasing in many markets, with one driving force being the need for transport buyers to shift to fossil-free transports in order to meet their sustainability goals.

Volvo 242
article thumbnail

NHTSA estimates 38,680 traffic fatalities in 2020, up 7.2% from 2019 despite 13.2% drop in VMT

Green Car Congress

The National Highway Traffic Safety Administration’s (NHTSA’s) statistical projection of traffic fatalities for 2020 shows that an estimated 38,680 people died in motor vehicle traffic crashes. This represents an estimated increase of about 7.2% as compared to the 36,096 fatalities reported in 2019. billion miles—about a 13.2%

article thumbnail

DOT: 89% reduction in US airline passengers in May 2020 y-o-y

Green Car Congress

US airlines carried 89% fewer scheduled service passengers in May 2020 than in May 2019, according to preliminary data filed with the Bureau of Transportation Statistics (BTS) by 20 airlines that carry more than 90% of the passengers. Source: DOT BTS.

2020 314
article thumbnail

Distances traveled on the road and in the air: 1970-2015

Green Car Congress

The calculated average passenger-distances traveled per person are shown in the table below, along with the average occupancy rates from the Bureau of Transportation Statistics. Furthermore, the focus here is not on total distances but on distances per person, because the U.S. population increased by 57% during the period studied.

2015 261
article thumbnail

Study links increased black carbon pollution to increase in cases of lung adenocarcinoma worldwide

Green Car Congress

The same study also concluded an overall lower consumption of tobacco worldwide is statistically linked to less people contracting lung squamous cell carcinoma (LSCC)—another type of NSCLC. The statistics on pollution were obtained from National Aeronautics and Space Administration (NASA). Gender and geography have a role.

Pollution 298
article thumbnail

Gogoro Batteries Power 90% of Taiwan’s Electric Scooters

CleanTechnica EVs

According to the Taiwanese government’s recently released 2022 statistics on scooter sales, Gogoro Network batteries powered five of the top six […].

article thumbnail

Gasoline consumption per capita in 2020 was on par with that in 1965

Green Car Congress

Gasoline consumption per capita was calculated using the population estimates in the ProQuest Statistical Abstract of the United States. Total consumption (millions of gallons). Consumption per capita. Consumption per capita dropped from 414 gallons in 2019 to 356 gallons in 2020, again a drop of 14%.

Gasoline 415
article thumbnail

Actual fuel economy of cars and light trucks: 1966-2017

Green Car Congress

However, the starting year of this analysis is 1966 because (1) for 1923 through 1935, fuel-economy information is available only for the entire fleet of all vehicles, and (2) from 1936 through 1965, light trucks were included with other trucks in the relevant statistics.?. Annual statistics from the U.S. Department of Transportation.

article thumbnail

Italy’s 2022 EV Struggle Charted Through Q3 — Plugins At 8.7% Market Share

CleanTechnica EVs

Official statistics through the first three […]. Following years of exponential growth, the spark of the EV revolution seems to have gone cold in one of the arguably most important auto markets — by volume and automotive history — in Europe and the world.

Plugin 112
article thumbnail

DOE: Average annual gasoline taxes paid per vehicle, by state, 2019

Green Car Congress

Department of Transportation, Federal Highway Administration, Highway Statistics 2017, Table VM-1; and tax data by state from the U.S. Source: Calculated by Oak Ridge National Laboratory using average annual miles and average fuel economy of the light-duty vehicle population from the U.S.

Gasoline 345