This site uses cookies to improve your experience. To help us insure we adhere to various privacy regulations, please select your country/region of residence. If you do not select a country, we will assume you are from the United States. Select your Cookie Settings or view our Privacy Policy and Terms of Use.
Cookie Settings
Cookies and similar technologies are used on this website for proper function of the website, for tracking performance analytics and for marketing purposes. We and some of our third-party providers may use cookie data for various purposes. Please review the cookie settings below and choose your preference.
Used for the proper function of the website
Used for monitoring website traffic and interactions
Cookie Settings
Cookies and similar technologies are used on this website for proper function of the website, for tracking performance analytics and for marketing purposes. We and some of our third-party providers may use cookie data for various purposes. Please review the cookie settings below and choose your preference.
Strictly Necessary: Used for the proper function of the website
Performance/Analytics: Used for monitoring website traffic and interactions
In early 2013, the Chinese government declared a war on air pollution and began instituting stringent policies to regulate the emissions of PM 2.5. Cities restricted the number of cars on the road, coal-fired power plants reduced emissions or were shuttered and replaced with natural gas. Over the course of five years, PM 2.5
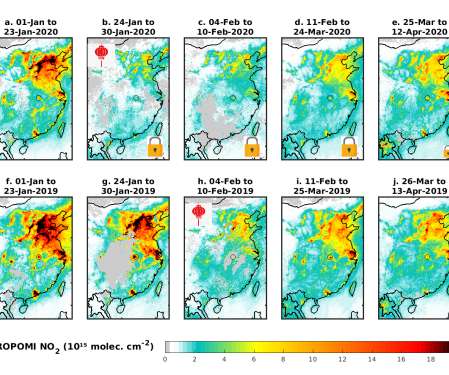
Levels of two major air pollutants have been reduced significantly since lockdowns began in response to the COVID-19 pandemic, but a secondary pollutant—ground-level ozone—has increased in China, according to new research. Maybe this unintended experiment could be used to understand better the emission regulations.
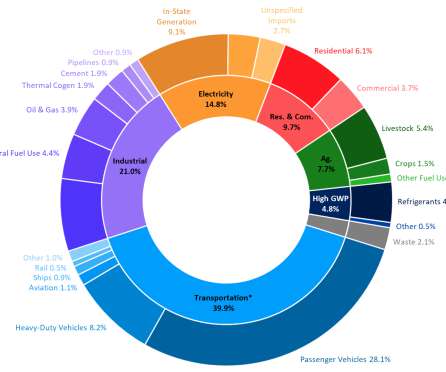
The California Air Resources Board’s latest state inventory of greenhouse gas emissions shows that California’s GHG emissions continue to decrease. Trends in California GHG Emissions. Changes in emissions by Scoping Plan sector between 2000 and 2017. MMTCO 2 e (6%) from 2013 to 2017. Source: ARB.
This analysis examined the effect of flight distance on greenhouse gas emissions per passenger, and compared emissions from flying different distances with annual emissions from driving. Greenhouse gas emissions were examined for 17 nonstop flights with round-trip distances ranging from 131 miles to 19,040 miles.
In China, people breathe ozone-laden air two to six times more often than people in the United States, Europe, Japan, or South Korea, according to a new international study published in Environmental Science & Technology Letters. 2017 for one ozone metric. 2017 are included.
Exposure to ozone, long associated with impaired lung function, is also connected to health changes that can cause cardiovascular disease such as heart attack, high blood pressure and stroke, according to a new study of Chinese adults. The findings associated ozone exposure with markers of platelet activation and increased blood pressure.
However, emissions do not just remain in conurbations; particles and gaseous pollutants can be transported thousands of kilometers by the wind. The transport and transformation of plumes from selected European and Asian major population centers (MPCs) will now be investigated with special focus on the rate of formation of ozone and aerosols.
CSIRO scientists have developed a new way to account for ozone in computer simulations of the climate. This latest modeling shows that the oceans take much less ozone out of the atmosphere than previously thought. Ozone (O 3 ) is formed by reactions of chemicals such as nitrogen oxides and volatile organic compounds—i.e.,
California’s latest greenhouse gas data shows that while the state continues to stay below its 2020 target for emissions, there is much more work to do to achieve carbon neutrality by 2045. California statewide GHG emissions dropped below the 2020 GHG Limit in 2016 and have remained below the 2020 GHG Limit since then.
Ozone pollution near Earth’s surface is one of the main ingredients of summertime smog. It is also not directly measurable from space due to the abundance of ozone higher in the atmosphere, which obscures measurements of surface ozone. —Jin et al.
Despite reports that global emissions of the potent greenhouse gas, HFC-23, were almost eliminated in 2017, an international team of scientists, led by the University of Bristol, has found atmospheric levels growing at record values. As a result, they reported that they had almost completely eliminated HFC-23 emissions by 2017.
The At-Berth Regulation is a critical tool for CARB to cut harmful toxic diesel emissions from ships docked in California ports, and we hope this penalty will send a message that violators will pay a hefty price if they fail to comply. The goal of CARB’s At-Berth Regulation is to reduce diesel emissions from ocean-going vessels (OGVs).
The processes that create ozone pollution in the summer can also trigger the formation of wintertime air pollution, according to a new study from researchers at the University of Colorado Boulder and NOAA, in partnership with the University of Utah. A key control strategy is to reduce emissions of the limiting reagent.
The US Environmental Protection Agency (EPA) has launched the Cleaner Trucks Initiative (CTI) to further decrease NO x emissions from on-highway heavy-duty trucks and engines. The US has made major reductions in NO x emissions, but it’s been nearly 20 years since EPA updated these standards.
Illustration of light-duty vehicle sales share by emission certification level projected to be required to meet. The California Air Resources Board (ARB) is developing a proposal for more stringent emission requirements—i.e., Super Ultra Low-Emission Vehicle (SULEV). proposed NMOG+NO x standards in new LEV III.
Having approval for such a high octane certification fuel would, the EPA proposed in the Tier 3 Notice of Proposed Rulemaking: help manufacturers that wish to raise compression ratios to improve vehicle efficiency, as a step toward complying with the 2017 and later light-duty greenhouse gas and CAFE standards (2017 LD GHG).
Mayor of Paris and Chair of C40 Cities Anne Hidalgo and Mayor of London Sadiq Khan announced they are working together to create schemes to score new cars based on their real-world emissions and their impact on air quality and to provide that data in an accurate and accessible form to the public. Earlier post.). Source: The ICCT.
Although China and India remain the world’s largest consumers of coal, a new University of Maryland-led study found that China’s sulfur dioxide emissions fell by 75% since 2007, while India’s emissions increased by 50%. The rapid decrease of sulfur dioxide emissions in China far exceeds expectations and projections.
Added three major new retailers to the program in 2017, including a game-changing partnership with Kwik Trip which successfully rolled out E15 at 300 sites in just four months. The higher the RVP of a fuel, the worse its emissions are. The RVP of gasoline can range from 7 to 15 psi. Ethanol itself has a very low volatility: ~2 psi RVP.
A new study quantifying emissions from a fleet of gasoline direct injection (GDI) engines and port fuel injection (PFI) engines finds that the measured decrease in CO 2 emissions from GDIs is much greater than the potential climate forcing associated with higher black carbon emissions from GDI engines.
SLCPs include black carbon (soot), methane and hydrofluorocarbons (HFCs)—the fastest-growing source of GHG emissions in California and globally—which are used as refrigerants, aerosol propellants and insulation. Therefore a target for forest-derived black carbon emission reductions is not included in the SLCP Strategy.
The eventual CTI rulemaking will establish new, more stringent emission standards for NO x and other pollutants for highway heavy-duty engines. From 2007 to 2017, US NO x emissions dropped by more than 40%. The US EPA issued an Advance Notice of Proposed Rulemaking (ANPR) for the Cleaner Trucks Initiative (CTI).
In addition, the program funds projects that assist in fulfilling Governor Brown’s Zero Emission Vehicles (ZEV) Action Plan, with a target of installing enough infrastructure to support 1 million ZEVs by 2020, and a 2025 target of having 1.5 An estimated 68 stations are needed to support the anticipated rollout of these vehicles in 2015-2017.
The ICCT team assessed baseline and alternative system emissions under a variety of different transition pathways using an ICCT model of MAC emissions in the passenger vehicle fleet. These were shown to be ozone-depleting, however, and were targeted for phasing out under the 1987 Montreal Protocol. relative to HFC-134a and 98.6%
This is in contrast to the conventional mobile AC system, where the cabin air is directly cooled by the refrigerant HFC-134a, which is ozone safe but has a high GWP. The new SL-MAC system, which is testing the low-GWP refrigerants, is expected to increase vehicle energy efficiency. Andersen, S., Chowdhury, S., Andersen, S., Chowdhury, S.,
Percent reduction in visible solar energy due to ambient PM (plus a small contribution from ozone) (A), only dust PM deposition (B) deposition of all PM components (C), and atmospheric and deposited combined (D; note change in scale). It’s yet another reason for policymakers worldwide to adopt emissions controls. Click to enlarge.
Traffic contributes more to NO x emissions in Europe than previously thought, according to a new study by a team at the University of Innsbruck. It has been a challenge to determine how much each polluter contributes to the emission output. The majority of the emissions is caused by diesel cars. —Thomas Karl.
In the first, they found that when fuel prices drove residents of São Paulo, Brazil, to mostly switch from ethanol to gasoline in their flexible-fuel vehicles, local ozone levels dropped 20%. Officials, Geiger said, will need to weigh the increase in ozone against the decrease in nanoparticles when ethanol is used.
Transportation is one of the largest contributors to urban air pollution for pollutants such as carbon monoxide, nitrogen oxides, benzene, ozone, and fine particulate matter (PM 2.5 ). Marshall (2017) “Does Urban Form Affect Urban NO2? As such, cities are a focal point for understanding and addressing environmental health issues.
A new study provides the most detailed picture available to date of the global, regional, and local health impacts attributable to emissions from four transportation subsectors: on-road diesel vehicles; other on-road vehicles; shipping; and non-road mobile engines such as agricultural and construction equipment. of global ambient PM 2.5
The largest systematic study ever conducted of human volunteers exposed to ozone air pollution has found no evidence of effects on the heart in its healthy, older participants, but did find effects on the volunteers’ ability to breathe, even at low ambient levels. Possible pathways by which ozone may cause adverse health effects.
A new international study has found that laboratory tests of nitrogen oxide emissions from diesel vehicles significantly underestimate the real-world emissions by as much as 50%. Real-world NO x emission factors by vehicle emissions standard in key regions. A paper on the work is published in the journal Nature.
The California Air Resources Board released the draft proposed first update to the AB 32 Scoping Plan, which guides development and implementation of California’s greenhouse gas emission reduction programs. California’s zero emission vehicle (ZEV) regulation is also driving a transformation of the fleet. Transportation.
This year’s report includes the latest results on air pollution exposure and its health burden around the world based on the 2017 GBD (Global Burden of Disease) study. Numbers of deaths attributable to air pollution in countries around the world in 2017. and tropospheric ozone. years) on average worldwide. Ambient PM 2.5
and of 10 ppb in ozone were associated with increases in all-cause mortality of 7.3% (95% confidence interval [CI], 7.1 of less than 12 μg per cubic meter and ozone of less than 50 ppb, the same increases in PM 2.5 and ozone were associated with increases in the risk of death of 13.6% (95% CI, 13.1 and 1.1% (95% CI, 1.0
The new EEA analysis is based on the latest official air quality data from more than 4,000 monitoring stations across Europe in 2017. Among the findings: Concentrations of particulate matter (PM) continued to exceed the EU limit values and the WHO AQGs in large parts of Europe in 2017. For PM with a diameter of 10 ?m
Results from CHIE studies are used to inform the periodic review of National Ambient Air Quality Standards (NAAQS) for common pollutants, such as ozone and particulate matter (PM), and advise other policy decisions. The NAAQS process has broad health importance because it regulates the outdoor air concentrations of those pollutants.
Ozone, another important component of outdoor air pollution, whose levels are on the rise around the world, contributed to 234,000 deaths from chronic lung disease. Population-weighted seasonal average ozone concentrations in 2016. Worldwide exposure to PM 2.5 contributed to 4.1 State of Global Air 2018.
During the winter months, Utah’s Wasatch Front experiences periodic weather inversions that trap emissions along the metropolitan valley. Ozone exposure was modestly associated with increased instances and severity of pneumonia in younger adults. g/m 3 , CI 1.16 – 1.57), severe pneumonia (lag-day-1 aOR 1.38, CI 1.06-1.80),
The scientific team examined associations of mortality from cancer at 29 sites with long-term residential exposure to three ambient pollutants: PM 2.5 , nitrogen dioxide (NO 2 ) and ozone (O 3 ). More than 43,000 non-lung cancer deaths were registered among the participants. μg/m 3 increase in exposure. —Turner et al.
Up there, 10 to 50 kilometers above the Earth’s surface, ozone molecules absorb the sun’s ultraviolet light, protecting life far below. Even less is understood about the potential risks to people and the environment—could the particles deplete the ozone layer, for example, or significantly alter the weather? Not everyone agrees.
The US Environmental Protection Agency (EPA) is proposing to retain, without changes, the existing, more stringent 2015 National Ambient Air Quality Standards (NAAQS) for ozone. From 2017 to 2019, ozone concentrations fell 4%. During that same time, national average ozone concentrations have dropped 25%. Background.
We organize all of the trending information in your field so you don't have to. Join 5,000+ users and stay up to date on the latest articles your peers are reading.
You know about us, now we want to get to know you!
Let's personalize your content
Let's get even more personalized
We recognize your account from another site in our network, please click 'Send Email' below to continue with verifying your account and setting a password.


Let's personalize your content