This site uses cookies to improve your experience. To help us insure we adhere to various privacy regulations, please select your country/region of residence. If you do not select a country, we will assume you are from the United States. Select your Cookie Settings or view our Privacy Policy and Terms of Use.
Cookie Settings
Cookies and similar technologies are used on this website for proper function of the website, for tracking performance analytics and for marketing purposes. We and some of our third-party providers may use cookie data for various purposes. Please review the cookie settings below and choose your preference.
Used for the proper function of the website
Used for monitoring website traffic and interactions
Cookie Settings
Cookies and similar technologies are used on this website for proper function of the website, for tracking performance analytics and for marketing purposes. We and some of our third-party providers may use cookie data for various purposes. Please review the cookie settings below and choose your preference.
Strictly Necessary: Used for the proper function of the website
Performance/Analytics: Used for monitoring website traffic and interactions
CNOOC Limited—China’s largest producer of offshore crude oil and natural gas and one of the largest independent oil and gas exploration and production companies in the world—is acquiring all of the Common Shares of Canada-based energy company Nexen Inc. It is the second-largest oil producer in the UK North Sea.
North Dakota crude oil production (including lease condensate) averaged an all-time high of 770,000 barrels per day in December 2012, according to the US Energy Information Administration (EIA). Much of crude oil production in North Dakota is gathered and transported by truck to railcars leaving the state. Source: EIA.
Prototype low-viscosity ionic liquid-additized engine oil demonstrated a 2% improved fuel economy compared to Mobil 1 5W-30 engine oil (3.93% over the 20W-30 baseline oil) in standard fuel efficiency engine dynamometer tests. 1%) in nonpolar hydrocarbon oils.
The majority (62%) of the plantations were located on the island of Sumatra, and more than two-thirds (69%) of all industrial plantations were developed for oil palm cultivation, with the remainder mostly being Acacia plantations for paper pulp production. Earlier post.). —Dr.
Average values for WTW GHG emissions for oil sands and other crudes, tight boundary. When the oil sands products refined in the United States are considered—a mixture of oil sands and lower-carbon blending components—the GHG emissions are, on average, 9% higher than the average crude processed in the US.
Despite the decision to de-emphasize microbial oil, Neste Oil emphasized that cellulosic waste will continue to play an important role in its research strategy, adding that it remains committed to its goal of further extending its feedstock base and making greater use of waste and residues in this area in particular.
quadrillion Btu in 2012 to 12.1 from 2012 to 2040, compared to 1.2% The rising fuel economy of LDVs more than offsets the modest growth in VMT, resulting in a 25% decline in LDV energy consumption decline between 2012 and 2040 in the AEO2014 Reference case. l/100 km) in 2012 to 37.2 l/100 km) in 2012 to 37.2
Calculated cumulative and net oil discharged from MC252. Credit: ACS, Griffiths 2012. Griffiths calculated oil flow rates and cumulative discharge using a physically-based model along with wellhead pressures measured at the blowout preventer (BOP) over the 86-day period following the Deepwater Horizon accident. million barrels.
million barrels per day of crude oil and liquids. The Enbridge Mainline system is the largest conduit of oil into the United States. Enbridge transports 53% of US-bound Canadian production, a figure that accounts for approximately 15% of total US crude oil imports. miles (2.4
Crude oil imports from the top five foreign suppliers to the United States—which in 2012 were Canada, Saudi Arabia, Mexico, Venezuela, and Iraq, in that order—accounted for almost 72% of total US net crude oil imports, the highest proportion since 1997, according to the US Energy Information Administration (EIA).
The world’s consumption of gasoline, diesel fuel, jet fuel, heating oil, and other petroleum products reached a record high of 88.9 Between 2008 and 2012, Asia’s consumption increased by 4.4 In 2011 and 2012, higher oil prices and increased fuel efficiency of light-duty vehicles contributed to reduced US consumption.
Map of basins with assessed shale oil and shale gas formations, as of May 2013. Among the highlights in the 2013 report is a 10-fold increase in the estimate of technically recoverable shale / tight oil from 32 billion barrels (from the EIA’s Annual Energy Outlook 2011 ) to 345 billion barrels. Source: US EIA. Click to enlarge.
Preliminary industry data reveals that year-end geothermal growth in 2012 was up 5% from the previous year, according to the Geothermal Energy Association ( GEA ). In 2012, seven new geothermal projects and additions came online in three different states. Projects and new additions that came online in 2012 include: John L.
Well-to-wheel (WTW) greenhouse gas emissions for in situ SAGD and surface mining pathways generated employing GHOST/TIAX/ GHGenius combination and comparison with SAGD, mining and conventional crude oil literature pathways (all results are on a HHV basis). 74% of WTW emissions in our oil sands pathways. Credit: ACS, Bergerson et al.
China is about to become the largest oil-importing country and India becomes the largest importer of coal by the early 2020s. The Middle East becomes the world’s second-largest gas consumer by 2020 and third-largest oil consumer by 2030, redefining its role in global energy markets. Oil use grows, but in a narrowing set of markets.
The US Arctic Alaska Petroleum Province holds mean estimates of undiscovered, technically recoverable oil and gas resources of nearly 30 billion barrels of oil, about 179 trillion cubic feet of nonassociated gas, and 40 trillion cubic feet of associated gas, according to a new assessment published by the US Geological Survey (USGS).
from January 2012). and for residual fuel oil by 26%, although it rose for other oils by 0.6%. in January compared with the same month in 2012. in January compared with the same month in 2012. from January 2012. from January 2012. Total US crude oil production in January rose above 7.0
increased its oil sands production 14% in 2013, from 89,736 barrels per day in 2013 to 102,500 bbls/day in 2013. The increase in production from the company’s oil sands operations in 2013 was largely driven by its Christina Lake project. Economic bitumen best estimate contingent resources increased 2% from 2012 to 9.8
An article in the latest issue of IEA Energy: The Journal of the International Energy Agency reports that Estonia, which has the most developed oil shale industry in the world, is collaborating in pursuing wider use of oil shale in a cleaner, more sustainable manner. Different that shale oil—i.e., million tonnes.
China’s apparent oil demand in October rose 2.9% Despite the year-over-year increase, China’s apparent oil demand in October slipped 2.5% Meanwhile, total apparent oil demand was 9.96 China’s oil product imports tumbled 22.2% China’s oil product imports tumbled 22.2% Fuel oil apparent demand in October slumped 31.4%
In this analysis, I examined the relation between crude-oil production and crude-oil reserves in the world and in the United States. The variable of interest was the amount of crude oil produced as a percentage of proved reserves of crude oil. For the world, production of crude oil in 1987 represented 3.0%
of China (COMAC) opened a demonstration facility that will turn waste cooking oil, commonly referred to as “gutter oil” in China, into sustainable aviation biofuel. billion liters) of biofuel could be made annually in China from used cooking oil. Boeing and Commercial Aircraft Corp.
As November draws to a close, there are two major events that could profoundly change the oil markets. He says a deal is more likely than not due to the enormous financial pressure Iran is experiencing because of falling oil prices. Iran’s oil exports have more than halved from their pre-sanctions level of about 2.5
The US Environmental Protection Agency (EPA) released its annual report summarizing key trends in carbon dioxide emissions, fuel economy, and CO 2 - and fuel economy-related technology for gasoline- and diesel-fueled personal vehicles sold in the United States, from model years (MY) 1975 through 2012. l/100km) or more.
The Alberta Biodiversity Monitoring Institute (ABMI) released the first comprehensive report on the status of Alberta’s species in the Athabasca Oil Sands Area (AOSA). It also contains the Athabasca oil sands deposit, which represents 77% of Canada’s proven oil reserves and supports a growing energy extraction sector. “
Secretary of the Interior Sally Jewell announced that the latest oil and gas lease sales for federal waters in the Gulf of Mexico garnered $872,143,771 million in high bids on 329 tracts covering 1,707,358 acres. The area will be offered to industry again in 2016 under the current Five Year Offshore Oil and Gas Leasing Program.
A new study by the International Council on Clean Transportation (ICCT) estimates heavy fuel oil (HFO) use, HFO carriage, the use and carriage of other fuels, black carbon (BC) emissions, and emissions of other air and climate pollutants for the year 2015, with projections to 2020 and 2025. Click to enlarge.
Oil palm supplies more than 30% of world vegetable oil production. The study, published as an open access paper in the journal Nature Climate Change , shows that deforestation for the development of oil palm plantations in Indonesian Borneo is becoming a globally significant source of carbon dioxide emissions.
The collapse in world oil prices in the second half of 2014 will have only a moderate impact on the fast-developing low-carbon transition in the world electricity system, according to research firm Bloomberg New Energy Finance. While diesel and oil-based power is still uneconomic at $60/barrel, the pressure to switch is reduced.
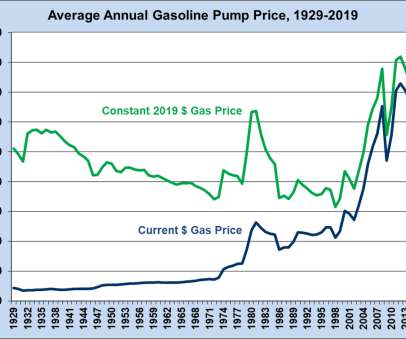
The graph below shows the effect of the oil embargo in the early 1980s. In 2012, prices reached the highest level in both current and constant dollars but began a steep decline thereafter. From 2002 to 2008, the price of gasoline rose substantially, but then fell sharply in 2009 during the economic recession.
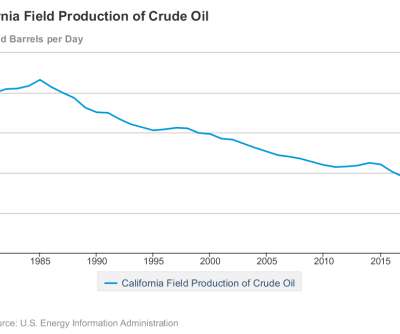
Additionally, Governor Newsom requested that the California Air Resources Board (CARB) analyze pathways to phase out oil extraction across the state by no later than 2045. California’s production of oil has been steadily dropping since 1985. According to the California Energy Commission, California oil represented 34.9%
Crude and lease condensate includes tight oil, shale oil, extra-heavy crude oil, field condensate, and bitumen (i.e., oil sands, either diluted or upgraded). oil shale), and refinery gain. OPEC oil producers are the largest source of additional liquid fuel supply between 2010 and 2040.
Supported by the company’s growing crude production in the Permian Basin, the project is the largest refinery expansion since 2012. The BLADE (Beaumont Light Atmospheric Distillation Expansion) project built a third crude unit within the facility’s existing footprint to expand light crude oil refining.
Increasing oil demand is requiring increasing imports; since 2009, China has been importing more than half of its petroleum needs. Under the Energy Saving and New Energy Vehicle Plan for 2012 to 2020 released in 2012, average passenger car fuel economy is targeted to increase to 34 miles per gallon (6.9 Source: EIA.
A breach in ExxonMobil’s Pegasus crude oil pipeline occurred late Friday afternoon near Mayflower, AR (about 20 miles north northwest of Little Rock and at the southeastern end of the Lake Conway reservoir). Efforts are being made to keep oil away from Lake Conway. Route of the Pegasus pipeline. Source: ExxonMobil. Click to enlarge.
Lux Research has investigated the trends of corporate financing of alternative fuels from oil majors, based on a non-exhaustive database of more than 1,000 deals and partnership engagements from 2000 through September, 2014. Shell invested in multiple rounds and formed a JV with Iogen, but terminated the JV in 2012.
The final model year (MY) 2012 adjusted, real world CO 2 emissions rate is 376 g/mi—a 22 g/mi decrease (-5.5%) relative to MY 2011. MY 2012 adjusted fuel economy is 23.6 mpg fuel economy improvement from MY 2011 to MY 2012 is the second largest annual improvement in the last 30 years. Click to enlarge. mpg, or 22%.
Source: Knittel and Smith (2012). t margin for oil refiners. Put simply, the empirical results merely reflect the fact that ethanol production increased during the sample period whereas the ratio of gasoline to crude oil prices decreased. Results from Du/Hayes are indicated by the large square. Click to enlarge.
Consumption of distillate fuel oil in the US West Coast, as measured by product supplied, decreased to its lowest level since 2002 last year and continues its decline this year, according to the latest “This Week in Petroleum” report from the US Energy Information Administration (EIA).
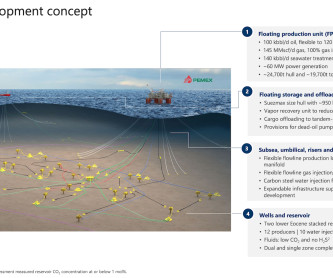
First oil is targeted for 2028. Trion was discovered in 2012 by PEMEX. Trion is a greenfield development that would represent the first oil production from Mexico’s deepwater. The resource will be developed through a floating production unit (FPU) with an oil production capacity of 100,000 barrels per day.
plans to invest more than $1 billion to install a new delayed coker unit at its Antwerp refinery to convert heavy, higher sulfur residual oils into transportation fuels products such as marine gasoil and diesel fuel. The investment addresses an industry shortfall in capability to convert fuel oil to products such as diesel.
Total subsidies for renewable energy stood at $66 billion in 2010 (a 10% increase from the year before); the total value of global fossil fuel subsidies is estimated at between $775 billion and more than $1 trillion in 2012, Two thirds of the renewable energy subsidies went to renewable electricity resources and the remaining third to biofuels.
OPEC exports have come under pressure this week from technical threats to oil fields, with Saudi Arabia’s Manifa problems grabbing the headlines. At the same time, Saudi Arabia’s export volumes have been hit by high local summer demand for crude oil and products. by Cyril Widdershoven for Oilprice.com.
from November 2012 to average 19.4 from November 2012 to average slightly more than 8.9 for “other oils.” from November 2012 as most refineries came back up from their scheduled turnaround and maintenance in the prior month. from November 2012 to an all-time high of 5.1 from November 2012 to just over 8.0
We organize all of the trending information in your field so you don't have to. Join 5,000+ users and stay up to date on the latest articles your peers are reading.
You know about us, now we want to get to know you!
Let's personalize your content
Let's get even more personalized
We recognize your account from another site in our network, please click 'Send Email' below to continue with verifying your account and setting a password.


Let's personalize your content