article thumbnail

California 2017 GHG inventory shows 1.2% total drop from 2016; transportation sector emissions up 1%

Green Car Congress

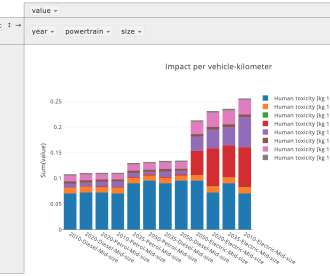
The California Air Resources Board’s latest state inventory of greenhouse gas emissions shows that California’s GHG emissions continue to decrease. Trends in California GHG Emissions. Changes in emissions by Scoping Plan sector between 2000 and 2017. Overview of GHG Emissions from the Transportation Sector.

2017 230
article thumbnail

EEA: almost all Euro car makers met specific 2017 CO2 targets on new sales, but emissions up year-on-year

Green Car Congress

All but three European car manufacturers met their specific emission targets in 2017, based on current European vehicle test rules. Nevertheless, average carbon dioxide (CO 2 ) emissions from new cars sold in the European Union in 2017 rose by 0.4g The final data show that average CO 2 emissions of a new car sold in the EU rose by 0.4

2017 170
article thumbnail

PSI team develops web tool for consumers to compare environmental impact of passenger cars in detail

Green Car Congress

The entire life cycle of the passenger cars is taken into account, including the manufacture of the vehicles and the environmentally relevant emissions from driving. Noise emissions [Person-Pascal/second]. For the future, the electricity mix can also be manually entered to test the effects of different scenarios.

Mariner 435
article thumbnail

EIA: US energy-related CO2 emissions down 2.4% in 2011 while GDP rose

Green Car Congress

The US Energy Information Administration (EIA) reported that after an increase in 2010 of 3.3%, energy-related carbon dioxide emissions in the US in 2011 decreased by 2.4% (136 million metric tons), while GDP grew by 1.8%. Energy-related carbon dioxide emissions have declined in the United States in four out of the last six years.

2011 231
article thumbnail

US EIA Reports Record-setting 7% Overall Decline in US Carbon Dioxide Emissions in 2009; Transport Emissions Down 4.1%, Lowest Percentage Reduction of the End-UseSectors

Green Car Congress

Factors contributing to the 7% drop in emissions in 2009. While emissions have declined in three out of the last four years, EIA noted, 2009 was “ exceptional ”. Carbon intensity changes in the electric power and industrial end use sectors. The average decline in energy intensity from 2000 to 2008 was 2.0%. Source: EIA.

2009 239
article thumbnail

EIA: US energy-related CO2 dropped 2.7% in 2015; of end-use sectors, only transportation increased

Green Car Congress

According to a report from the US Energy Information Administration (EIA), US energy-related CO 2 emissions decreased by 146 million metric tons (MMmt) in 2015 to 5,259 MMmt, down 2.7% Energy-related CO 2 emissions in 2015 were about 12% below 2005 levels. —“US Energy-Related Carbon Dioxide Emissions, 2015”. Electricity.

2015 150
article thumbnail

New cars in Europe in 2013 collectively met 2015 CO2 target two years ahead of the deadline

Green Car Congress

AFV are alternative fuel vehicles: electric, LPG, NG-biomethane, E85, biodiesel, hybrid and plug-in vehicles. The average CO 2 emissions level of a new car sold in 2013 was 127 g CO 2 /km; the target for 2015 was 130 g/km. The average per-km CO 2 emissions for gasoline-fueled cars was 128.62 Source: EEA. Click to enlarge.

2013 231