This site uses cookies to improve your experience. To help us insure we adhere to various privacy regulations, please select your country/region of residence. If you do not select a country, we will assume you are from the United States. Select your Cookie Settings or view our Privacy Policy and Terms of Use.
Cookie Settings
Cookies and similar technologies are used on this website for proper function of the website, for tracking performance analytics and for marketing purposes. We and some of our third-party providers may use cookie data for various purposes. Please review the cookie settings below and choose your preference.
Used for the proper function of the website
Used for monitoring website traffic and interactions
Cookie Settings
Cookies and similar technologies are used on this website for proper function of the website, for tracking performance analytics and for marketing purposes. We and some of our third-party providers may use cookie data for various purposes. Please review the cookie settings below and choose your preference.
Strictly Necessary: Used for the proper function of the website
Performance/Analytics: Used for monitoring website traffic and interactions
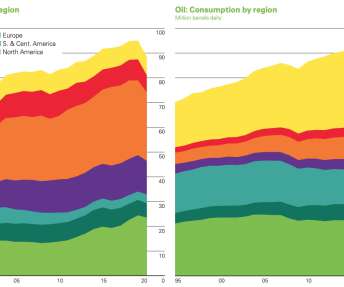
bp released the 70 th annual edition of the bp Statistical Review of World Energy ; the data collected in this year’s edition includes energy data for 2020. Carbon emissions from energy use fell by more than 6% in 2020, the largest decline since 1945. Key highlights: Primary energy consumption fell by 4.5%
A new black carbon (BC) emissions inventory from China found BC emissions levels in 2007 of 1,957 Gg BC—higher than reported in earlier studies. Black carbon is released into the atmosphere via incomplete combustion of carbonaceous fuel and is of major concern because of the impact on climate systems. Credit: ACS, Wang et al.
East Coast metropolitan statistical areas (J), with a larger map of New York metropolitan area (K, outer line) and New York City (K, inner line) highlight the consistent pattern of relatively low GHG urban core cities and high GHG suburbs. Credit: ACS, Jones and Kammen. Click to enlarge. —Jones and Kammen.
Global carbon dioxide emissions from burning fossil fuels have increased by 49% in the last two decades, according to the latest figures from the Global Carbon Project. Total emissions—including fossil fuel combustion, cement production, deforestation and other land use emissions—reached 10 billion tonnes of carbon (36.7
According to the operational statistics, electric buses today are the most reliable type of surface public transport. Replacing diesel buses with electric ones on these bus routes will help to reduce carbon dioxide emissions by 5.2 Moscow continues to adapt infrastructure and urban transport in accordance with the Green Agenda.
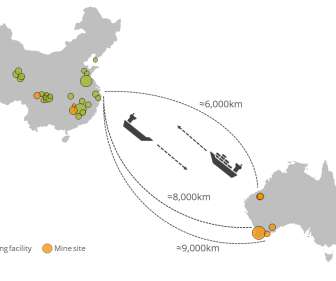
Shipping emissions form a significant part of the commodity supply chain’s carbon footprint, particularly for those commodities reliant on the mass transport of low-grade ores and concentrates. Roskill has analyzed the trend in carbon intensity of shipping using spodumene concentrate as an example. Regulatory background.
The first real-world, head-to-head comparison of improved cookstoves (ICs) and traditional mud stoves has found that some ICs may at times emit more of the black carbon particles that are linked to serious health and environmental concerns than traditional mud stoves or open-cook fires. —Kar et al.
In a paper published in the journal Fuel , the team reported: No statistically significant fuel effect on nitrogen oxide (NO x ) emissions for E15. Total hydrocarbons (THC), non-methane hydrocarbons (NMHC), and carbon monoxide (CO) showed either marginally or statistically significant reductions for E15.
seen in 2010, according to the newly released BP Statistical Review of World Energy, 2012. Coal was again the fastest growing fossil fuel with predictable consequences for carbon emissions; it now accounts for 30.3% Click to enlarge. Global energy consumption grew by 2.5% of the LNG increase. more as natural gas was diverted to Asia.
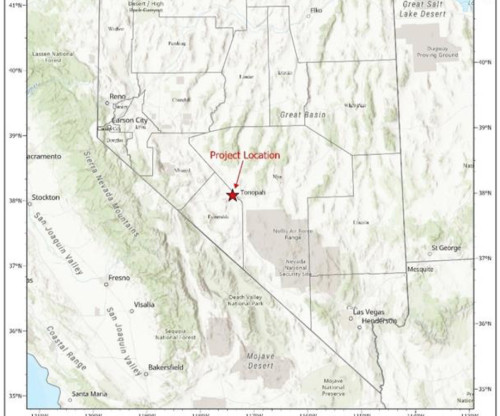
million tons of lithium carbonate equivalent. The sample was homogenized by cone-and-quarter methods and pulverized to 100 mesh to obtain a statistically repetitive sample. The inferred resources report concludes that Tonopah Flats may hold an estimated 15.8
This statistic is remarkable, [continued] The post Nepal’s Electric Leapfrog: How This Himalayan Nation Is Leading Global EV Adoption appeared first on CleanTechnica. In recent months, about 70% of all new passenger vehicles sold in Nepal were electric.
The analysis indicates that natural carbon sinks are maintaining overall resilience despite recent signs that the carbon uptakes of specific sinks are in decline. Approximately 40-45% of carbon emissions emitted every year remain in the atmosphere, with the balance absorbed as part of the Earth’s carbon cycle. per decade.
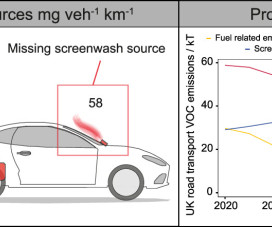
Scaling of industry sales statistics enabled the discrepancy to be attributed to the use of ancillary solvent products such as screenwash and deicer which are not included in internationally applied vehicle emission methodologies. —Cliff et al. the products used for “car care,” such as windshield washer fluid.
A new European Joint Research Centre (JRC) study looking into the supply of raw materials for the manufacture of low-carbon energy technologies found that eight metals were at high risk of shortages. The SET Plan was launched in 2008 with the objective to accelerate the development and deployment of cost-effective low carbon technologies.
Despite the economic effects of the global financial crisis (GFC), carbon dioxide emissions from human activities rose 2% in 2008 to an all-time high of 1.3 tonnes of carbon per capita per year, according to a new paper published by an international team of 31 scientists in Nature Geoscience. Global carbon budget 2008.
The area chart shows the increase of CO 2 emissions calculated from the national energy statistics since 1997 broken down by different fuel type. The dashed line represents the aggregated CO2 emissions calculated from the provincial energy statistics 1997–2010. The column chart presents the 1.4? Source: Guan et al. Click to enlarge.
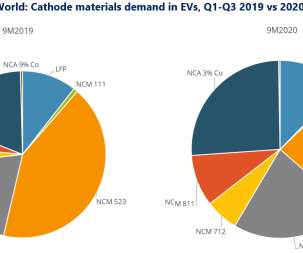
Prices for lithium carbonate recovered sharply in Q4 2020 as many manufacturers are increasingly looking at production of LFP-type cathodes or using lithium carbonate for low- to mid-nickel cathode materials.
APTA statistics for early 2011 show that 18.6% APTA statistics for early 2011 show that 18.6% billion gallons of gasoline use and 37 million metric tons of carbon emission every year. The American Public Transportation Association (APTA) recently reported that 35.6% of public transit buses were hybrids; and 7.9%
The data centers that house the physical computing infrastructure used for running applications are widely known for their large carbon footprint; they currently account for about 0.3% of global greenhouse gas emissions, or about as much carbon as the country of Argentina produces annually, according to the International Energy Agency.
The benefit to the climate of using biofuels as a substitute for fossil fuels has been sharply contested for years; much of the disagreement is based on the assumptions underlying the carbon accounting in the lifecycle analysis. Assuming that biogenic carbon flows are always in balance over a biomass product’s lifecycle—i.e.,
A new statistical method developed by researchers at KAUST (King Abdullah University of Science and Technology, Saudi Arabia) can detect abnormal ozone levels within large bodies of monitored data. The monitoring methods can quickly and accurately detect ozone anomalies—localized spikes in ozone concentration indicated by sensor data.
Carbon emissions associated with increased exports from China (left), as part of a more systematic view of increased national emissions (right), 2002 to 2005. Researchers from Norway, the United Kingdom, and the United States, estimated in the study that China’s 2005 carbon emissions were 80.59% or more higher than 2002 emissions. “
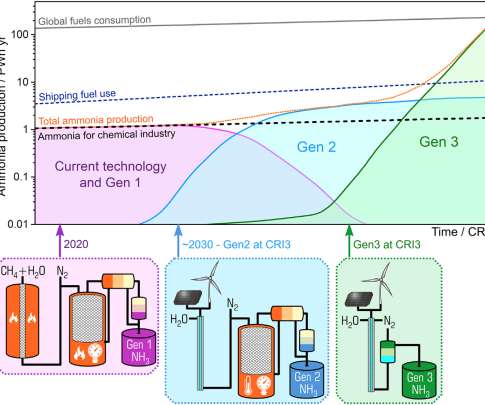
Gen 1 involves the use of carbon sequestration or offsets to bring the net carbon impact of the ammonia production to zero (blue ammonia). Carbon sequestration adds cost and plant complexity on top of the existing H-B technology. —MacFarlane et al. Generation 1. Note the logarithmic ordinate scale.
the E30 and E78—led to statistically significant reductions of 9%–13% for total hydrocarbon (THC); 13%–44% for non-methane hydrocarbon (NMHC); 20%–35% for carbon monoxide (CO); and 17%–36% for nitrogen oxides (NO x ) emissions compared to the high-aromatics E10 fuel. The study found that higher ethanol blends—i.e.,
An analysis of future vehicle total costs of ownership (TCO) in the UK found that low carbon cars can make substantial progress in bridging the current cost gap by 2030. According to the report, low carbon cars are likely to require continuing financial support in the form of differential taxation if they are to be widely adopted in future.
BP released the 68 th annual edition of the BP Statistical Review of World Energy (BP Stats Review), a comprehensive collection and analysis of global energy data. This year’s edition highlights the growing divergence between demands for action on climate change and the actual pace of progress on reducing carbon emissions.
The US National Science Foundation (NSF) and Japan Science and Technology Agency (NSF-JST) have launched a joint program, Metabolomics for a Low Carbon Society (METABOLOMICS), and are soliciting research projects. Conceptual sketch of future metabolomics challenges and opportunities from May 2010 NSF-JST workshop on metabolomics.
Featuring a lightweight, ultra-strong monocoque carbon fiber frame, the CrownCruiser e-bike comes with a rider recognition anti-theft defense, GSM location tracking, and Bluetooth, complimented by a powerful app that tracks riding statistics. UK-based CrownCruiser Motors has unveiled its eponymous e-bike on Indiegogo.
It clearly shows that there are a range of potential routes to deliver significant carbon reductions, including both increased electrical mobility with battery vehicles and plug-in hybrids but also low carbon liquid and gaseous fuels. Life Cycle CO 2 e Assessment of Low Carbon Cars 2020-2030.
A new report by the UK’s Office for National Statistics (ONS) finds that greenhouse gas (GHG) emissions from road transport in the UK rose by 6% from 1990 to 2017. Source: Office for National Statistics – UK Environmental Accounts, Energy Use datasets. Among the other findings of the report: At the end of 2018, 0.5%
Studies have shown that biodiesel generally reduces carbon monoxide (CO), particulate matter (PM), and total hydrocarbons (THC) emissions compared to conventional diesel fuel. In California, biodiesel use accounted for 86% of the alternative fuels consumed by the state fleet in 2010. Earlier post.). for R20, 5.4%-10.2% for R50, and 9.9%-18.1%
A new study quantifying emissions from a fleet of gasoline direct injection (GDI) engines and port fuel injection (PFI) engines finds that the measured decrease in CO 2 emissions from GDIs is much greater than the potential climate forcing associated with higher black carbon emissions from GDI engines. versus 6.3 ± 1.1 versus 6.3 ± 1.1
China’s National Bureau of Statistics (NBS) has revised key economic figures for 2008 following its second national economic census, including gross domestic product (GDP) growth rate, energy use growth rate, and rate of reduction in energy use per unit of GDP. The country’s 2008 GDP growth rate has been revised upward from 9.0
Carbon dioxide emissions from these rigs would be able to be significantly reduced if these faults were rectified by as much as 15%, according to a large-scale test that tyre manufacturer Michelin carried out in partnership with Volvo Trucks. Two-thirds of Europe’s truck rigs are driving around with incorrect wheel alignment.
It also showed that global annual emissions of greenhouse gases increased from 24 billion tonnes of carbon dioxide equivalents in 1970 to 33 billion tonnes in 1990 and 41 billion tonnes in 2005. EDGAR used the latest international statistics and data on greenhouse gas emissions to model emissions for every country in the world.
The growth of global industrialization, increasing demand on energy resources and rising carbon emissions are deepening the need for energy infrastructure that is increasingly green, distributed, flexible, and resilient. Grid balancing and resilience is not a challenge borne out of our transition to a net-zero carbon economy.
Results of GIS statistical analysis for CO 2 : (a) eGrid subregion emissions factors (kg CO 2 /kWh), (b) average emissions factor for each district (kg CO 2 /kWh), (c) coefficient of variation of CO 2. emissions factor by district, and (d) difference between eGrid subregion emissions factor and US average emissions factor, 0.65
” Bayesian statistics incorporate prior knowledge, along with a given set of current data, to make statistical inferences. Lemoine developed a hierarchical Bayesian framework that explicitly represents sources of uncertainty in climate models such as common biases and unknown and unmodeled feedbacks.
Overall, carbon dioxide emissions would be reduced by 4.7% Furthermore, there continues to be a large gap between self-reported statistics and independent estimates in some countries. The effects of the subsidy removal would extend beyond the end of the phaseout period. in 2020 and 5.8%
The report also considers the efficiency (and inefficiencies) in the current system, as well as considering the aggressive investments that other trade blocs are making in new infrastructure and lower-carbon transportation—investments that may be outpacing efforts in North America. Shifting to lower-carbon fuels. Training Eco-drivers.
The end-Permian extinction is associated with a mysterious disruption to Earth’s carbon cycle. First, we show that geochemical signals indicate superexponential growth of the marine inorganic carbon reservoir, coincident with the extinction and consistent with the expansion of a new microbial metabolic pathway.
Senate Bill 32, signed in 2016, requires the state to go even further than AB 32 and cut greenhouse gas emissions 40% below 1990 levels by 2030—the most ambitious carbon goal in North America. The carbon intensity of California’s economy has dropped 38% since the 2001 peak and is now one-half the national average.
Decomposition of the decadal change in total global CO 2 emissions from fossil fuel combustion by four driving factors; population, income (GDP) per capita, energy intensity of GDP and carbon intensity of energy. giga tonne carbon dioxide equivalent (GtCO 2 eq) (2.2%) per year from 2000 to 2010 compared to 0.4 Click to enlarge.
We organize all of the trending information in your field so you don't have to. Join 5,000+ users and stay up to date on the latest articles your peers are reading.
You know about us, now we want to get to know you!
Let's personalize your content
Let's get even more personalized
We recognize your account from another site in our network, please click 'Send Email' below to continue with verifying your account and setting a password.


Let's personalize your content