This site uses cookies to improve your experience. To help us insure we adhere to various privacy regulations, please select your country/region of residence. If you do not select a country, we will assume you are from the United States. Select your Cookie Settings or view our Privacy Policy and Terms of Use.
Cookie Settings
Cookies and similar technologies are used on this website for proper function of the website, for tracking performance analytics and for marketing purposes. We and some of our third-party providers may use cookie data for various purposes. Please review the cookie settings below and choose your preference.
Used for the proper function of the website
Used for monitoring website traffic and interactions
Cookie Settings
Cookies and similar technologies are used on this website for proper function of the website, for tracking performance analytics and for marketing purposes. We and some of our third-party providers may use cookie data for various purposes. Please review the cookie settings below and choose your preference.
Strictly Necessary: Used for the proper function of the website
Performance/Analytics: Used for monitoring website traffic and interactions
Current emissions of anthropogenic greenhouse gases (GHGs) have already committed the planet to an increase in average surface temperature by the end of the century that may be above the critical threshold for tipping elements of the climate system into abrupt change with potentially irreversible and unmanageable consequences, the authors write.
the distribution of black carbon in the atmosphere and determine its role in the climate system. Black carbon (BC) is the second largest man-made contributor to global warming and its influence on climate has been greatly underestimated, according to the first quantitative and comprehensive analysis of this pollutant’sclimate impact.
Radiative forcing due to perpetual constant year 2000 emissions grouped by sector for 2020 (left) and 2100 (right) showing the contribution from each species. Cars, buses, and trucks release pollutants and greenhouse gases that promote warming, while emitting few aerosols that counteract it. From Unger et al., Click to enlarge.
A recent study by an international team calculated that shipping causes a net cooling of climate across all parametrizations of the indirect aerosol effect (IAE) and scenarios throughout the period 1900?2050. Shipping-induced global temperature change in 2050 using different parameterizations of Indirect Aerosol Effect (IAE).
Projected changes in summer mean usable capacity of power plants in the US and Europe for the SRES A2 emissions scenario for the 2040s (2031–2060) relative to the control period (1971–2000). A study published in Nature Climate Change suggests that thermoelectric power plants (i.e., Source: van Vliet et al. Click to enlarge.
Global sulfur dioxide (SO 2 ) emissions peaked in the early 1970s and decreased until 2000, with an increase in recent years due to increased emissions in China, international shipping, and developing countries in general, according to a new analysis appearing in the open access journal Atmospheric Chemistry and Physics.
As a result of their findings, published in the 30 October issue of the journal Science , the authors argue that assessments of multigas mitigation policies, as well as any separate efforts to mitigate warming from short-lived pollutants, should include gas-aerosol interactions. Shindell et al. Drew Shindell.
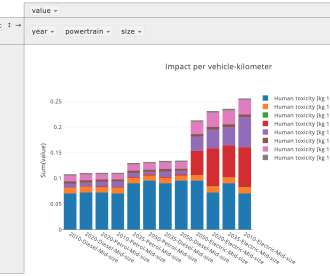
The system will graph lifecycle impact for a range of specified powertrains, for a large number of impact categories: Climate change [kg CO 2 -eq.]. The top sample above shows climate change impact; the subsequent chart shows human toxicity. Sample results from Carculator. Depletion of fossil energy resources [kg oil-eq.].
The US Environmental Protection Agency (EPA) has submitted its final Report to Congress on Black Carbon , in response to an October 2009 request from Congress to advance efforts to understand the role of black carbon (BC) in climate change. Effects of BC on climate, as compared to GHGs. Earlier post.). Earlier post.).
The authors, under the umbrella of the Global Carbon Project , reported a 29% increase in global CO 2 emissions from fossil fuel between 2000 and 2008 (the latest year for which figures are available), and by 41% between 2008 and 1990, the reference year of the Kyoto Protocol. between 2000 and 2008, compared with 1% per year in the 1990s.
This potential leap in destructiveness and pollution—mainly from an increase in wildfire frequency—is forecast by computer models calculating impacts of moderate global warming on western US wildfire patterns and atmospheric chemistry. The increase is due mainly to the simulated rise in wildfire frequency in the future, warmer climate.
For the first time since UCS began the Automaker Rankings report in 2000, all eight major automakers reduced their average greenhouse gas (GHG) and smog-forming emissions compared to their fleet averages from 1998, the model year examined in the first report. Climate Change Coal Emissions Fuel Efficiency' Source: UCS. Click to enlarge.
Researchers at the University of Maryland and the University of Texas, Austin, have created a database that includes visibility measurements taken from 1973 - 2007 at 3,250 meteorological stations all over the world and released by the National Climatic Data Center (NCDC). NASA technique.
The California Air Resources Board (CARB) has posted a revised draft of California’s proposed Short-Lived ClimatePollutant (SLCP) Strategy. SLCPs are a category of pollutants which remain in the atmosphere for a relatively brief period, but have global warming potentials that are much higher than those of CO 2.
Europe’s transport sector is making only mixed progress in meeting its environment, health and climate policy targets, according to the latest European Environment Agency (EEA) assessment which tracks the short and long-term environmental performance of this key economic sector across the European Union. Air pollution. in 2015 to 7.1%
The data shows a slight increase in overall emissions from the previous year, and a slight decline in emissions from transportation, which is the state’s main source of both GHGs and air pollutants. All these climate programs have considerably more stringent emissions reduction targets starting in 2021. tons per person to 10.7
US EPA Region 9 8-hour ozone trends, 1979-2000. The two areas suffer from some of the worst air quality in the country due to a number of factors, such as meteorology, geography, climate and weather. These new SIPs demonstrate that, by 2024, pollution will be reduced to the level needed to attain the 1997 8-hour ozone standard of 0.08
Demand for plastics—the key driver for petrochemicals from an energy perspective—has outpaced all other bulk materials (such as steel, aluminium, or cement), nearly doubling since 2000.
Ozone levels across much of North America and Europe dropped significantly between 2000 and 2014. In some parts of Asia, Africa and South America, the researchers identified data gaps which prevented them from characterizing ozone pollution exposure patterns. Source: University of Leicester. Click to enlarge. Owen Cooper.
During the flexible price period, an overall cap will be placed on Australia’s annual greenhouse gas emissions from all sources of pollution covered by the carbon price. We have had a long debate about climate change in this country. Economists and experts agree that the best way is to make polluters pay by putting a price on carbon.
Effects of changes in the average lifespan of ordinary passenger cars newly registered between 1990-2000 on total induced CO 2 emissions in 2000. They also found that extending the lifetime of a vehicle contributed to a moderate increase in emissions of criteria pollutants (NO x , HC, and CO) during the use phase of the vehicle.
An analysis by Deutsche Bank Climate Advisors, however, suggests that production of 1.1 Automobiles are major contributors to air pollution and greenhouse gas emissions. Car travel in non-OECD countries doubled between 1975 and 2000, but it then picked up pace by doubling again in just the decade to 2010.
A team from the University of California, Berkeley concludes that reducing demand for light-duty vehicle (LDV) travel will likely be essential to meeting the international greenhouse gas emission and climate targets for the year 2050. persons per vehicle, typical of European averages in 2000. Sager et al. ” —Sager et al.
Bar chart of 2000 to 2013 GHG emissions by category as defined in the Scoping Plan. Overall trends in the inventory also demonstrate that the carbon intensity of California’s economy, the amount of carbon pollution per million dollars of GDP, is declining. Click to enlarge. per year over the past four years as GDP grew 6.6%
EPA’s current secondary standards for particle pollution are identical to the primary standards for PM 2.5 EPA is proposing that the current secondary standards are adequate to protect against PM-related visibility impairment, climate effects, and effects on materials. and PM 10 , except for the annual PM 2.5 Average PM 2.5
But in a year that has seen both a worsening recession and state budget crisis, residents’ support for urgent action on climate change has slipped and a partisan divide on the issue has widened. But in the current economic climate their support has dropped a notch. Californians clearly support policies to improve the environment.
If offshore installation and maintenance costs are to some considerable degree attributable to the burning of fuel oil in vessels, associated pollution is important. As for toxic releases from waste handling, disposal of tailings in relation with mineral resource extraction and disposal of smelter slag are dominant pollution sources.
and Par Hawaii Refining that resolves alleged Clean Air Act violations and protects public health by reducing air pollution at six refineries. Strict internal leak definitions: 500 ppm for valves and 2000 ppm for pumps. Refineries also emit greenhouse gases that contribute to climate change, as well as fugitive VOCs.
The theme of the current issue of Nature is that the climate situation may be even worse than you think. Two possible futures: One in which no climate policies are implemented (red), and one with strong action to mitigate emissions (blue). Without climate policies, global warming will cross 2 °C by the middle of the century.
Air pollution. Emissions of regulated air pollutants from vehicles continue to fall across EEA member countries but concentrations remain high in some urban areas. TERM reports have been published since 2000. Tags: Climate Change Emissions Europe Market Background Policy. Transport at a crossroads. EEA Report No 3/2009 ).
Biofuels are commonly touted as a dual solution to the problems of dependence on foreign energy sources and climate change, but their impacts are not confined to these two areas. We also examined geographic trends.
Percent change in median CO2 by scenario relative to 2000. A Georgia Tech City and Regional Planning study on climate change concludes that “smart growth” combined with the use of hybrid vehicle technology could reduce cities’ carbon dioxide (CO 2 ) emissions significantly by 2050. Stone et al. 2009) Click to enlarge.
These proposed requirements will provide near-term NO x , particulate matter, and GHG emissions reductions to help meet nearer term air quality, climate, and petroleum targets. What are potential new and creative approaches to meet climate goals with innovative transit solutions beyond buses? Source: ARB. Click to enlarge. Background.
National and state regulators primarily use generic emission inventories to assess the climate, air quality, and health impacts of natural gas systems. Between 2000 and 2011, the number of producing gas wells in the US increased by 50%, reaching 514,637.
They counted more than 500 electric passenger vehicles of all those types worldwide in the period from 2000 to 2013. Number of series-production electric vehicles by OEM, 2000-2013. The largest share of PHEVs were found between a vehicle curb weight of 1500 kg (3,300 lbs) and 2000 kg (4400 lbs). Click to enlarge.
The California ARB is in the process of redesigning its Zero Emission Vehicle (ZEV) program to affect the 2015+ model years, with a focus on reducing greenhouse gases as well as criteria pollutants, and with an emphasis on plug-in hybrid, electric and fuel cell vehicles. Earlier post.). Michael O’Brien.
Apart from contaminated sites, the mercury pollution detected today is often found in locations very far away from its original source. This heavy metal is persistent and is dispersed throughout the world by atmospheric transport. Use of coal for power generation and industry is increasing, especially in Asia.
Its the fourth-largest mercury polluter in the state, producing around 12 times as much mercury as is allowed by a new EPA rule. In total, the grants will support 5,000 jobs and reduced climatepollution by 11 million tons per year, according to the USDA. SMECIs grant will reduce climatepollution by 1.8
The company is presenting the production i-MiEV as the ultimate eco-car, a solution to the various challenges the automobile faces today including environmental pollution, global warming and the depletion of petroleum-based energy supplies. Maximum output is 47 kW at 3000-6000 rpm, with maximum torque of 180 N·m (133 lb-ft) from 0-2000 rpm.
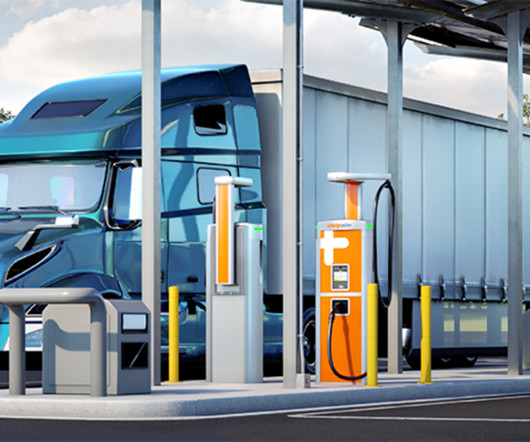
The Megawatt Charging System cable and connector will be available on ChargePoint’s Power Link 2000 stations, part of its modular Express Plus DC fast charging platform. The greatest benefit of electrifying the trucking sector is the significant reduction of emissions, as transportation represents the largest polluting segment.
Opened in 1955, Autopia was originally sponsored by Richfield Oil (which later merged into ARCO), and then by Chevron from 2000 to 2012. Local air pollution can cause asthma in kids , and communities of color are adversely burdened by vehicle air pollution, a 2022 study found.
From its 3982 cc displacement, the new V8 biturbo produces more than 350 kW (476 hp) with a maximum torque of around 700 Nm from 2000 rpm. The new driving simulator, climatic wind tunnels and a high-tech aero-acoustic wind tunnel are already in operation. The new V8 will launch with this technology next year in the new S-Class.
Although most countries have already revealed their opening emissions reduction proposals, UNFCCC Executive Secretary Yvo de Boer pointed out Thursday that “ we still await clarity from industrialized nations on the provision of large-scale finance to developing countries for immediate and long-term climate action. by Jack Rosebro.
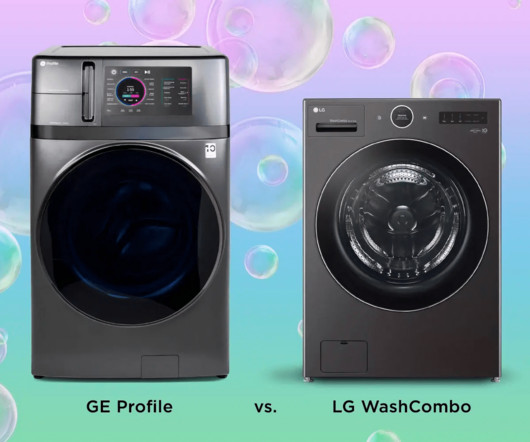
The freed-up 240V space in the breaker box is perfect timing for those people replacing their pollution-spewing oil/gas heaters with heat pumps/geothermal or adding an electric vehicle outlet or two in their garage. In fact, upgrading service/breaker boxes cost can often be less than the whole $2000-$2500 price of the washer/dryer upgrade!
We organize all of the trending information in your field so you don't have to. Join 5,000+ users and stay up to date on the latest articles your peers are reading.
You know about us, now we want to get to know you!
Let's personalize your content
Let's get even more personalized
We recognize your account from another site in our network, please click 'Send Email' below to continue with verifying your account and setting a password.


Let's personalize your content