Remove Energy Remove Gasoline-Electric Remove Miles Remove Transportation
article thumbnail

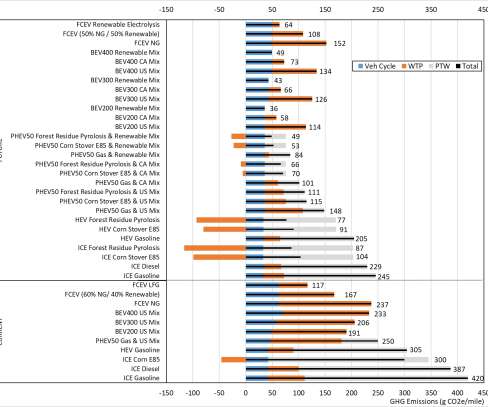
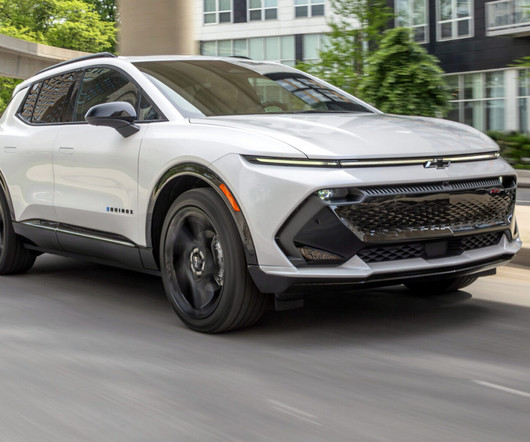
DOE: Life cycle GHG emissions for 2020 electric small SUV were half those of a conventional gasoline small SUV

Green Car Congress

Using current technologies, all evaluated biofuel, battery electric, and hydrogen fuel cell vehicle pathways offer significant C2G GHG emissions reduction compared to the current gasoline internal combustion engine vehicle. Key assumptions for these two scenarios (e.g., powertrain efficiency, component weights, etc.)

article thumbnail

Zeem launches first commercial electric vehicle Transportation-As-A-Service depot

Green Car Congress

Fleet electrification provider Zeem Solutions has opened its first commercial EV transportation-as-a-service depot in Inglewood, California, near Los Angeles International Airport (LAX). Zeem owns and maintains electric trucks, vans, shuttle buses and other vehicles that are leased to businesses that pay a monthly lease to use the vehicles.

article thumbnail

EIA projects decline in transportation sector energy consumption through 2037 despite increase in VMT, followed by increase

Green Car Congress

EIA’s Annual Energy Outlook 2019 projects continued robust growth in US energy production, emergence of the United States as an energy exporter, and a cleaner S electric power generation mix. This growth arises from increases in air transportation outpacing increases in aircraft fuel efficiency.

article thumbnail

EEA: Walking, cycling and public transport in cities remain greener mobility options than electric scooters or car ride-hailing

Green Car Congress

A new report by the European Environment Agency (EEA) finds that, taken together with public transport, walking and cycling for short city journeys provide the greatest benefits for both human health and the environment in urban areas. A simple example would be a short trip by electric kick scooter.

article thumbnail

Actual fuel economy of cars and light trucks: 1966-2019

Green Car Congress

The primary measure in this analysis is the average miles driven per gallon of fuel for each year. Department of Transportation. Department of Transportation were the sources of the information for 1986 through 2019. gallons per 100 miles to 5.10 gallons per 100 miles) represents a compound rate of decrease of 2.3%

article thumbnail

EPA GHG Inventory shows US GHG down 1.7% y-o-y in 2019, down 13% from 2005

Green Car Congress

This decrease was driven largely by a decrease in emissions from fossil fuel combustion resulting from a decrease in total energy use in 2019 compared to 2018 and a continued shift from coal to natural gas and renewables in the electric power sector. Transportation. CO 2 emissions decreased 2.2% from 2018 to 2019. Source: EPA.

2005 418
article thumbnail

U Mich, Ford lifecycle study of carbon footprint of last-mile and final-50-feet delivery with automated vehicles and robots

Green Car Congress

The COVID-19 pandemic boosted interest in automated transport technologies as a contactless way to help customers get their purchases. However, there hasn’t been an assessment of how robots and automated vehicles impact the already energy-intensive process of transporting packages from local distribution centers to customers’ front doors.

Miles 221