This site uses cookies to improve your experience. To help us insure we adhere to various privacy regulations, please select your country/region of residence. If you do not select a country, we will assume you are from the United States. Select your Cookie Settings or view our Privacy Policy and Terms of Use.
Cookie Settings
Cookies and similar technologies are used on this website for proper function of the website, for tracking performance analytics and for marketing purposes. We and some of our third-party providers may use cookie data for various purposes. Please review the cookie settings below and choose your preference.
Used for the proper function of the website
Used for monitoring website traffic and interactions
Cookie Settings
Cookies and similar technologies are used on this website for proper function of the website, for tracking performance analytics and for marketing purposes. We and some of our third-party providers may use cookie data for various purposes. Please review the cookie settings below and choose your preference.
Strictly Necessary: Used for the proper function of the website
Performance/Analytics: Used for monitoring website traffic and interactions
EPA projects advanced transmissions (6+ speeds and CVTs), gasoline direct injection (GDI) systems, and turbocharged engines will be installed on at least 15% of all MY 2013 vehicles. The majority of the emissions and fuel savings from current vehicles, EPA noted, is due to new gasoline vehicle technologies. Click to enlarge.
Adjusted CO 2 emissions and adjusted fuel economy, MY 1975-2011. Data for MY 2011 are final; data for MY 2012 are preliminary and based on projected vehicle production values provided to EPA by manufacturers. The fleet-wide average real world MY 2011 personal vehicle CO 2 emissions value is 398 g/mi and average fuel economy is 22.4
A team of researchers in China suggest that, in the context of promoting the use of clean fuel vehicles and increasing vehicle fuel efficiency, CO 2 emissions of China’s urban passenger transport sector could reach a peak of 225 MtCO 2 in 2030. A paper on their study appears in the journal Energy Policy. —Li and Yu.
Average values for WTW GHG emissions for oil sands and other crudes, tight boundary. When the oil sands products refined in the United States are considered—a mixture of oil sands and lower-carbon blending components—the GHG emissions are, on average, 9% higher than the average crude processed in the US. Source: IHS CERA.
From left to right: EV, PHEV, gasoline/diesel, gasoline/diesel. One label design prominently features a letter grade (ranging from A+ to D) to communicate the vehicle’s overall fuel economy and greenhouse gas emissions performance. A sample of the second proposed label for an extended range electric vehicle. Source: EPA.
US greenhouse gas emissions by gas. The US Environmental Protection Agency (EPA) released its 19 th annual report of overall US greenhouse gas (GHG) emissions, showing a 3.4% decrease in 2012 from 2011. Total emissions of the six main greenhouse gases in 2012 were equivalent to 6,526 million metric tons of carbon dioxide.
Comparison of brake thermal efficiency and specific fuel consumption at rated power (ICOMIA Mode 5), hydrogen vs. gasoline engines. For one, the [California Air Resources Board] CARB-established limit of HC+NO x emissions in the 7.4 For one, the [California Air Resources Board] CARB-established limit of HC+NO x emissions in the 7.4
At the 2012 North American International Auto Show in Detroit, Volvo Car Corporation will unveil the Volvo XC60 gasoline-electric Plug-in Hybrid Concept. In February 2011 at the Geneva Motor Show, Volvo introduced the diesel-electric V60 Plug-in Hybrid (PHEV) to go on sale in Europe later this year. Click to enlarge.
Well-to-wheels results for greenhouse gas emissions in CO 2 e for six pathways. These advances and improvements have helped bioethanol achieve increased energy and GHG emission benefits when compared with those of petroleum gasoline. WTW GHG emission reductions for ethanol pathways relative to gasoline. Miscanthus.
DOT’s National Highway Traffic Safety Administration (NHTSA) is proposing Corporate Average Fuel Economy (CAFE) standards under the Energy Policy and Conservation Act (EPCA), as amended by the Energy Independence and Security Act (EISA), and EPA is proposing national greenhouse gas (GHG) emissions standards under the Clean Air.
The study’s findings highlight the importance of considering exposures—especially the proximity of emissions to people—when evaluating environmental health impacts for EVs, the team said. note that the focus of their study was motivated in part by the unprecedented rise in popularity of electric two-wheelers in China.
2012 Honda Civic Natural Gas. The all-new 2012 Honda Civic Natural Gas (formally known as the Civic GX), the only dedicated natural gas-powered passenger vehicle manufactured and sold in the US, will go on sale at qualified Honda dealerships nationwide on 18 October with a Manufacturer’s Suggested Retail Price (MSRP) starting at $26,155.
It's been a long and painful year for Fisker Automotive, with deliveries of its 2012 Karma extended-range electric sport sedan repeatedly delayed from the original target of May.
Audi will start series production of the A8 hybrid in 2012. TFSI gasoline engine and an electric motor develop peak output of 180 kW (245 hp) and 480 N·m (345 lb-ft) of torque. mpg US); CO 2 emissions are below 148 grams per km (238 g/mile). miles) with zero local emissions at a constant speed of 60 km/h (37 mph).
California Clean Vehicle Rebate Project rebates by vehicle type through July 2012. Californians own more than 12,000 plug-in electric vehicles (PEVs), roughly 35% of all plug-in vehicles in the United States. As of July 2012, approximately 1,000 new plug-in vehicles are being sold in the state every month. Source: CCSE.
Comparisons of life-cycle emissions from LUC phase for (a) sugar cane ethanol and (b) soybean biodiesel. Expansion in Brazil presents unique opportunities for both liquid fuel and electricity production. However, the potential for land-use change to also cause important non-GHG air pollution emissions (e.g., Click to enlarge.
The EPA has rated the 2012 Fisker Karma luxury extended range electric vehicle as consuming 65 kWh/100 miles (52 MPGequivalent) when running in all-electric mode, having a 32-mile all-electric range, and consuming 5.1 gallons US/100 miles (~20 mpg) when running the gasoline range-extending engine in hybrid mode.
Mazda Motor Corporation will hold the world premiere of the all-new Mazda6 sedan (known as Mazda Atenza in Japan), totally redesigned for the first time in five years, at the 2012 Moscow Motor Show, 29 August to 9 September 2012. gasoline engine and six-speed SKYACTIV–DRIVE automatic transmission.
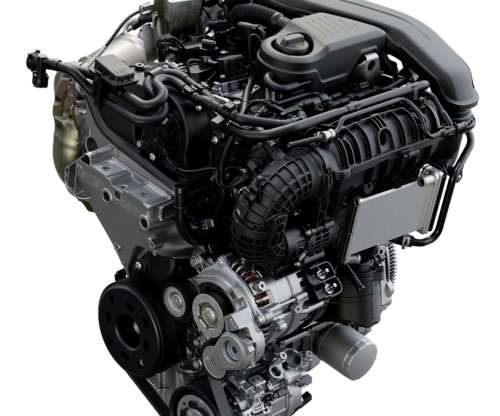
TSI gasoline engine and is now introducing the latest generation, the TSI evo2, in the first models in Europe. The highlights of the latest version include Active Cylinder Management ACTplus, an emission control module close to the engine and the modern TSI-Evo combustion process. Volkswagen has enhanced its bestselling 1.5
Contributions of regions to total life cycle emissions for three fuels (µg per vehicle-mile traveled per km 2 land area). Dashed lines show US average emissions. Associated tailpipe emissions alone account for 40?60% Credit: ACS, Tessum et al. Click to enlarge. —Tessum et al.
The California Energy Commission unanimously adopted a 2012-2013 Investment Plan Update to increase the use of green vehicles and alternative fuels. million for charging options for full-electric and plug-in electric vehicles. million for E85 fuel (85 percent ethanol, 15 percent gasoline) and $1.5
million zero emission vehicles on the roads in their states by 2025, along with the refueling infrastructure required to support those vehicles. This multi-state effort is intended to expand consumer awareness and demand for zero-emission vehicles. US electric car sales in 2012 more than tripled to about 52,000 from 17,000 in 2011.
Kia Motors has introduced Korea’s first production electric vehicle from a major manufacturer. The new Kia Ray EV is an electric city car with a range of up to 139 km (86 miles) on a single charge. liter gasoline powered Ray CUV, which went on sale in Korea last month. Click to enlarge. Earlier post.). Earlier post.).
During fiscal 2012 Mitsubishi Motors will add an EV-based Outlander model which will use a plug-in hybrid system derived from MMC’s already existing EV technology. The European-market specification Outlander is offered with a choice of gasoline and diesel engines. Gasoline models are powered by the 4J11 2.0-liter
2012 Mazda3. The refreshed 2012 Mazda3, making its debut at the 2011 Canadian International AutoShow, will offer the option of Mazda’s new SKYACTIV-G gasoline engine and SKYACTIV-Drive automatic transmission ( earlier post ) when it is launched later this fall. SKYACTIV-G gasoline direct injection engine.
Proportion of lifecycle CO 2 e emissions for future cars 2020-2030. The main conclusions of that study were that future CO 2 e metrics for passenger cars need to go “beyond the tailpipe” and take account of whole life cycle CO 2 e emissions to more fully account for environmental impacts. Battery Electric Vehicle (BEV).
The California Air Resources Board’s latest state inventory of greenhouse gas emissions shows that California’s GHG emissions continue to decrease. Trends in California GHG Emissions. Changes in emissions by Scoping Plan sector between 2000 and 2017. Emissions are organized by the categories in the AB 32 Scoping Plan.
The final report shows overall emissions in 2010 increased by 3.2% EPA attributes the trend to an increase in energy consumption across all economic sectors, due to increasing energy demand associated with an expanding economy, and increased demand for electricity for air conditioning due to warmer summer weather during 2010.
Significant vehicle weight reduction and an accompanying change of enabling regulations and norms is the way forward in the quest to reduce energy consumption and CO 2 emissions, according to Paris-based Frost & Sullivan Senior Consultant, Nicolas Meilhan. Worldwide, not more than 100,000 electric vehicles are expected to be sold in 2012.
quadrillion Btu in 2012 to 12.1 from 2012 to 2040, compared to 1.2% The rising fuel economy of LDVs more than offsets the modest growth in VMT, resulting in a 25% decline in LDV energy consumption decline between 2012 and 2040 in the AEO2014 Reference case. l/100 km) in 2012 to 37.2 l/100 km) in 2012 to 37.2
BMW is applying a range of technologies to reduce fuel consumption and emissions. l/100 km (57 mpg US) and CO 2 emissions of 109 g/km. BMW will add further engines to the line-up in 2012, when the BMW ActiveHybrid 3 (using a powertrain similar to that of the ActiveHybrid 5, earlier post ) will also make its premiere.
The US Department of Energy (DOE) Advanced Research Projects Agency – Energy (ARPA-E) has selected 66 research projects to receive a total of $130 million in funding through its “OPEN 2012” program. Select projects in OPEN 2012 include: ARPA-E OPEN 2012 selections: Advanced Fuels. Methane Converter to Electricity and Fuel.
The Institute of Electrical and Electronics Engineers (IEEE) selected a team of Honeywell developers for its 2012 Control Systems Technology Award in recognition of the team’s work in developing the OnRAMP Design Suite for Powertrain Control.
The federal subsidy significantly favors larger battery packs to a stronger degree than their potential for additional gasoline savings. Peterson and Michalek 2012. Non-domestic charging infrastructure is generally not necessary for operation of PHEVs, and substantial gasoline displacement can be achieved solely with home charging.
Environment Canada recently released a consultation paper on the development of proposed regulations to limit greenhouse gas (GHG) emissions from new on-road heavy-duty vehicles. The US announced first-ever fuel efficiency and greenhouse gas emission standards for medium- and heavy-duty vehicles earlier in August. Earlier post.).
GM has expanded the offering of ecoFLEX technologies throughout the Opel passenger car portfolio, resulting in reduced fuel consumption and emissions, along with some gains in output and torque. Model Year 2012 brings two new ecoFLEX models into the Astra line-up. The five-door Astra ecoFLEX model is available with both 1.7
Overall, the company says, it intends to continue to work to conserve energy by improving fuel efficiency and reducing emissions, and by diversifying fuel sources by encouraging the use of electricity, hydrogen and other alternative energies. Toyota’s EQ EV will deliver electric power consumption of 104 Wh/km. Gasoline engines.
Ford will begin applying start-stop technology—currently used in Ford hybrids and some Ford cars in Europe—in conventional cars, crossovers and SUVs in North America in 2012. Ford’s patented new Auto Start-Stop system for gasoline engines will improve fuel economy for most drivers by at least 4%.
US energy-related CO 2 emissions decreased by 89 million metric tons (MMmt), from 5,259 MMmt in 2015 to 5,170 MMmt in 2016. over that period, other factors contributing to energy-related CO 2 emissions more than offset the growth in GDP, leading to a 1.7% Natural gas CO 2 emissions have increased every year since 2009.
The dual fuel engine can operate in LPG and gasoline mode and is available in two power versions: 103 kW/140 hp with 200 N·m/148 lb-ft of torque in the Astra 5-door and Sports Tourer and with 88 kW/120 hp with 175 N·m/129 lb-ft in the Meriva. In the autumn of 2012, Opel’s ecoFLEX spectrum will be further expanded when the 1.4
Proposed allocation of 2011-2012 investment plan. The staff of the California Energy Commission has prepared a draft 2011-2012 Investment Plan for the Alternative and Renewable Fuel and Vehicle Technology Program, its third year of program funding. Click to enlarge. Anticipated. priorities established in the investment plan.
Mitsubishi Motors (MMC) will launch a plug-in hybrid version of its new Outlander (introduced at the current Geneva Motor Show) during the course of FY2012 (1 April 2012 to 31 March 2013). The new PHEV Outlander will be a permanent 4WD electric vehicle, supplemented by a gasoline engine when needed. 1 compression ratio.
Average CO2 emissions for the entire Peugeot range has dropped from 128.6 at the end of May 2012. As a result, 79% of Peugeot vehicles have CO 2 emissions of less than 140 g/km. Peugeot is targeting average CO 2 emissions of 116 g/km in 2015. The new CO 2 figures go as allow as 90 g/km for the 208 1.6
liter engine will be one of the first on the market to combine gasoline direct injection (DI) with twin independent variable camshaft timing (Ti-VCT) and E85 flex fuel capability. The North American version of the 2012 Ford Focus will be powered by a 2.0-liter The North American version of the 2012 Ford Focus will be powered by a 2.0-liter
We organize all of the trending information in your field so you don't have to. Join 5,000+ users and stay up to date on the latest articles your peers are reading.
You know about us, now we want to get to know you!
Let's personalize your content
Let's get even more personalized
We recognize your account from another site in our network, please click 'Send Email' below to continue with verifying your account and setting a password.


Let's personalize your content