This site uses cookies to improve your experience. To help us insure we adhere to various privacy regulations, please select your country/region of residence. If you do not select a country, we will assume you are from the United States. Select your Cookie Settings or view our Privacy Policy and Terms of Use.
Cookie Settings
Cookies and similar technologies are used on this website for proper function of the website, for tracking performance analytics and for marketing purposes. We and some of our third-party providers may use cookie data for various purposes. Please review the cookie settings below and choose your preference.
Used for the proper function of the website
Used for monitoring website traffic and interactions
Cookie Settings
Cookies and similar technologies are used on this website for proper function of the website, for tracking performance analytics and for marketing purposes. We and some of our third-party providers may use cookie data for various purposes. Please review the cookie settings below and choose your preference.
Strictly Necessary: Used for the proper function of the website
Performance/Analytics: Used for monitoring website traffic and interactions
Alberta, Canada’s Climate Change and Emissions Management (CCMEC) Corporation is awarding more than C$37.5 Since 2007, Alberta companies that annually produce more than 100,000 tonnes of greenhouse gas emissions are legally required to reduce their greenhouse gas intensity by 12%. million (US$36.6 million (US$1.76
The California Air Resources Board (CARB) announced that greenhouse gas emissions in California in 2016 fell below 1990 levels for the first time since emissions peaked in 2004—a reduction roughly equivalent to taking 12 million cars off the road or saving 6 billion gallons of gasoline a year.
A team of 26 climate scientists from Australia, Austria, Canada, France, Germany, Switzerland, the United Kingdom, and the United States have published the “Copenhagen Diagnosis”, an interim synthesis report on developments in climate change science from mid-2006 to the present day.
California’s latest greenhouse gas data shows that while the state continues to stay below its 2020 target for emissions, there is much more work to do to achieve carbon neutrality by 2045. California statewide GHG emissions dropped below the 2020 GHG Limit in 2016 and have remained below the 2020 GHG Limit since then.
Nicolas Hulot, France’s new minister responsible for environment and energy, presented the country’s new climate plan at a press conference at the Ministry. The plan at this current level of detail does not specify whether or not that is tailpipe emissions or full lifecycle emissions, factoring in upstream for electric vehicles.)
The country had undergone the biggest urban expansion in the period, between 2001 and 2018, its BUA increase accounted for 47.5% Breakdown of the 841 large cities by country income-levels: 353 cities (42.0%) from high-income countries (e.g. The findings also revealed rapid urbanization of large cities in China in the last two decades.
The on-road transportation (ORT) and power generation (PG) sectors are major contributors to CO 2 emissions and a host of short-lived radiatively-active air pollutants, including tropospheric ozone and fine aerosol particles, that exert complex influences on global climate. database) from another global inventory for the year 1996.
km-resolution MISR aerosol properties over Southern California for years 2001–2003, 2007–2009 and 2013–2015. The MISR instrument used in the study was initially designed to help understand Earth’s climate. Maps of 3-year averaged PM 2.5 sulfate, nitrate, OC and EC concentrations estimated using 4.4 Click to enlarge.
Geographical distributions of global BC emissions from motor vehicles in 1976 (A) and 2006 (B). Researchers at Peking University have developed a new methodology to model black carbon (BC) emissions from diesel and gasoline motor vehicles. An earlier global BC emission inventory by Bond et al. Credit: ACS, Wang et al.
A study published earlier this year in the journal Nature Climate Change that cast doubt on whether biofuels produced from corn residue could meet federal mandates for cellulosic biofuels to reduce greenhouse gas emissions by 60% compared to gasoline ( earlier post ) has drawn critical response published as correspondence in the same journal.
GHG emissions for ATP shale (low and high cases) and conventional gasoline in grams of CO 2 e per MJ of final fuel delivered. These emissions are 1.5 times larger than emissions from conventionally produced gasoline. Full-fuel-cycle GHG emissions are estimated to be 129 g CO 2. Credit: ACS. Click to enlarge. These are ~1.5-1.75
Singapore will implement a new Carbon Emissions-Based Vehicle Scheme (CEV) on 1 January 2012, providing rebates to qualified new cars, taxis, and imported used cars with low carbon emissions, and imposing an equivalent surcharge on higher emitting vehicles. The CEV will be applicable till 31 December 2014.
Global CO 2 emissions from fuel use and cement production by region. Emissions increased by 1.7% Global CO2 emissions increased from 15.3 The lower increase in CO 2 emissions was mainly due to a decrease in global fossil oil consumption of about 0.6%, the first global decrease since 1992. Source: PBL. Click to enlarge.
The low annual rate of global reduction of carbon emissions per unit of GDP needed to limit global warming to 2 °C—based on the probability assessments of the UN IPCC—is insufficient to achieve that goal, according to the latest Low Carbon Economy Index published by business consultancy PwC. per year through 2050.
Contribution of modeled CO 2 emissions from SOC to the life cycle of biofuel from corn residue. The findings cast doubt on whether biofuels produced from corn residue can be used to meet federal mandates for cellulosic biofuels to reduce greenhouse gas emissions 60% compared to gasoline. Error bars are ± one standard deviation.
Energy-related CO 2 emissions declined by 2.8% US carbon dioxide emissions from fossil fuels decreased by 2.8% This is the largest annual decline in energy-related carbon dioxide emissions since EIA began annual reporting on greenhouse gas emissions. Transportation sector CO 2 emissions by fuel types (1990 to 2008).
A major study has revealed that global carbon dioxide (CO2) emissions from forest fires have surged by 60% since 2001. The post Forest fires fuel alarming rise in global CO2 emissions appeared first on Innovation News Network. Find out more.
In total, switching to Neste MY Renewable Diesel will allow the airport to save almost 3,000 tons of greenhouse gas emissions (CO 2 e) annually compared to the use of fossil diesel. By using Neste MY Renewable Diesel, greenhouse gas emissions (GHG) are reduced by as much as 90% over the life cycle of the fuel compared to fossil diesel.
Sales of diesel particulate filters (DPFs) for trucks and buses in California increased at the end of 2013 and in the first half of 2014 compared to the first half of 2013, according to the results of a survey released by the Manufacturers of Emission Controls Association (MECA).
Since 2001, the USPS has operated 30 electric two-ton vehicles on the streets of New York City, and these were later joined by a pair of two-ton hybrid electric vehicles in Long Island. The cap-and-trade program also creates a financial incentive for industries to invest in clean technologies and develop innovative ways to reduce pollution.
Currently, the data included in the Department of Energy’s US Life Cycle Inventory is based on three years, 1998 to 2001. This LCA project is based on US agricultural data for the 2001-2007 period. Hexane emissions at crushing facilities decreased over 70% compared to the 1998 data (going from 10.15 kg (for the 3.36 kilograms).
The complexity of new and future vehicles—driven by the need for increasing fuel efficiency and decreasing emissions with ever-changing drive-cycle demands and environmental conditions—is adding unprecedented flexibility in design and driving the need for better simulation and more powerful computers, observed Dr. Robert M.
Divergence of real-world CO 2 emissions from manufacturers’ type-approval CO 2 emissions for various on-road data sources, including an average estimate for private and company cars as well as all data sources. In total, these sources furnish fuel consumption and CO 2 emission data from more than half a million vehicles.
Volkswagen only managed to create significantly positive Sustainable Value in 2001, 2002 and 2007. Ford has also languished in negative territory from 2001 onwards, and only temporarily showed signs of recovery in 2004 and 2005 (although still not managing to create positive Sustainable Value).
Our relationship started about a month ago when we spent an evening together carpooling to a UCLA workshop on communication climate change that we both participated in. I began our interview by asking Lillian about the early days of EPN which she helped found in 2001. What was your environmental priority in 2001 and what is it today?
The average gap between official fuel consumption figures and actual fuel use for new cars in the EU has reached 42%, according to the latest update by the International Council on Clean Transportation (ICCT) to its on-going research into vehicle fuel consumption and CO 2 emissions. com (Spain); and the car club TCS (Switzerland).
The plant has adopted technologies to keep the facility dust free and is fully climate controlled to manage humidity and create the most suitable environment for quality engine production. They meet the Euro IV emission standard and can be used in front-, rear- or all-wheel-drive applications. liter and 2.8-liter More than 1.3
Therefore drawing of conclusions from level 3 tests, further than the ones already drawn from level 1 and level 2 tests regarding the safe operation of the refrigerant R1234yf in MAC systems, is not appropriate, considering the definition of “safe product” in the General Product Safety Directive 2001/95/EC. … —JRC report.
The California Air Resources Board released the latest edition of the state’s Greenhouse Gas Emission Inventory , which shows that emissions fell by 1.5 Bar chart of 2000 to 2013 GHG emissions by category as defined in the Scoping Plan. The law set a target of reducing emissions to 1990 levels by 2020. Click to enlarge.
The two areas suffer from some of the worst air quality in the country due to a number of factors, such as meteorology, geography, climate and weather. Motor vehicle exhaust, industrial emissions, and chemical solvents are the major sources of these ozone precursors. Earlier post.).
I contributed the following to the World Wildlife Climate Witness site last week and it was published this morning. In 2001 she terminated our grass lawns and replaced them with drought tolerant plants because of her concerns for water use. By 2050 the law calls for us to reduce our emissions 80% below our 1990 levels.
The goal of the U-M/SJTU Collaborative Research Program in Renewable Energy Science and Technology is to develop new technologies that reduce global carbon emissions and their impact on climate change. In 2001, U-M became the first non-Chinese academic institution approved to offer graduate engineering degrees in China, at SJTU.
The goal of the U-M/SJTU Collaborative Research Program in Renewable Energy Science and Technology is to develop new technologies that reduce global carbon emissions and their impact on climate change. In 2001, U-M became the first non-Chinese academic institution approved to offer graduate engineering degrees in China, at SJTU.
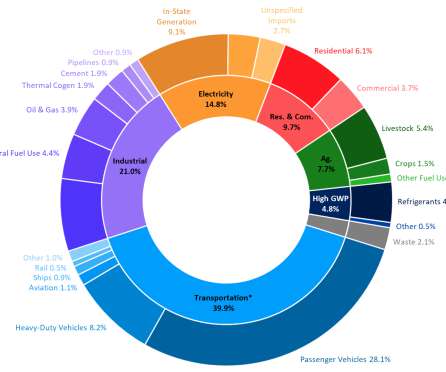
US GHG emissions by sector, 1990-2013. Total US greenhouse emissions were 6,673 million metric tons of carbon dioxide equivalent in 2013, an increase of 2% (127.9 over the prior year, according to the EPA’s newly published Inventory of US Greenhouse Gas Emissions and Sinks: 1990–2013. Total US emissions have increased by 5.9%
Early in September, the California Air Resources Board (ARB) announced it would consider in a 23-24 October meeting amendments to the Zero Emission Vehicle (ZEV) regulation that would modify the requirements for intermediate volume manufacturers (IVMs) selling into the state to allow them more time to come into the market. Earlier post.).
The Carbon Trust is an independent company set up in 2001 by the UK government in response to the threat of climate change, to accelerate the move to a low carbon economy by working with organizations to reduce carbon emissions and develop commercial low carbon technologies.
Change in annual linear snow cover from 1990 to 2001. However, these observations are too incomplete to be used in climate models.) “ We may be underestimating the amount of black carbon by as much as a factor of four ,” Menon says. Black carbon alone contributes at least 30% of this sum. Menon et al. Click to enlarge. Resources.
Addressing key global environmental issues such as climate change, water shortages, resource depletion, and degradation of biodiversity, the Toyota Environmental Challenge 2050 aims to reduce the negative impact of manufacturing and driving vehicles as much as possible. Achieving sales of 1.5
According to a report from the US Energy Information Administration (EIA), US energy-related CO 2 emissions decreased by 146 million metric tons (MMmt) in 2015 to 5,259 MMmt, down 2.7% Energy-related CO 2 emissions in 2015 were about 12% below 2005 levels. —“US Energy-Related Carbon Dioxide Emissions, 2015”.
The focus will be on the economy, sustainability and practicality of tailpipe emission-free delivery vans when used for the last mile. Electric mobility plays a key role as part of our long-term strategy for climate and environmental protection. —Frank Rausch, CEO of Hermes Germany GmbH.
Among the findings of the report, “HFC-134a phase-out in the Chinese light-duty motor vehicle sector”, was that, considering the social cost of CO 2 e, up to 1 trillion RMB in costs (US$150 billion) required to address climate change could be avoided through 2050 by transitioning to low-GWP alternative MACs. relative to HFC-134a and 98.6%
A report commissioned by the Natural Resources Defense Council (NRDC) and prepared by Chuck Shulock finds that the California Zero-Emission Vehicles (ZEV) regulations—also adopted by nine other states—requires a ‘tune-up’ to ensure the market expands well beyond current sale levels. Chuck Shulock. Background. Earlier post.).
The current paper expands this work to several scenarios that involve multiple charge opportunities per driving day, and advocates a well-to-wheel analysis of vehicle-based CO 2 emissions, rather than just tailpipe emissions, to inform several questions: What kind of plug-in vehicles will enable CO 2 reductions most effectively?
It’s been around since 2001. The International Council on Clean Transportation (ICCT) is a US-headquartered think tank with offices globally. continued] The post ICCT’s Hydrogen For Aviation Perspective Is Deeply Wrong As Well appeared first on CleanTechnica.
We organize all of the trending information in your field so you don't have to. Join 5,000+ users and stay up to date on the latest articles your peers are reading.
You know about us, now we want to get to know you!
Let's personalize your content
Let's get even more personalized
We recognize your account from another site in our network, please click 'Send Email' below to continue with verifying your account and setting a password.


Let's personalize your content