This site uses cookies to improve your experience. To help us insure we adhere to various privacy regulations, please select your country/region of residence. If you do not select a country, we will assume you are from the United States. Select your Cookie Settings or view our Privacy Policy and Terms of Use.
Cookie Settings
Cookies and similar technologies are used on this website for proper function of the website, for tracking performance analytics and for marketing purposes. We and some of our third-party providers may use cookie data for various purposes. Please review the cookie settings below and choose your preference.
Used for the proper function of the website
Used for monitoring website traffic and interactions
Cookie Settings
Cookies and similar technologies are used on this website for proper function of the website, for tracking performance analytics and for marketing purposes. We and some of our third-party providers may use cookie data for various purposes. Please review the cookie settings below and choose your preference.
Strictly Necessary: Used for the proper function of the website
Performance/Analytics: Used for monitoring website traffic and interactions
New analysis has found increasing emissions of several ozone-depleting chemicals despite their production being banned for most uses under the Montreal Protocol—and a loophole in the rules is likely responsible. According to the researchers, emissions from these CFCs currently do not significantly threaten ozone recovery.
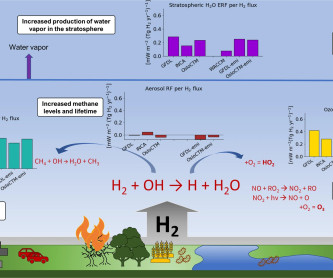
A study led by Norwegian climate center CICERO has found that the global warming effect of leaked hydrogen is almost 12 times stronger than that of CO 2. Rather, it is the leaking of hydrogen from production, transportation and usage that adds to global warming. A global warming potential of 11.6 Sand et al. Sand et al.
They found that the increase in ozone burden due to the spatial distribution change slightly exceeds the combined influences of the increased emission magnitude and global methane. Based on their findings, they suggested that emission increases in Southeast, East and South Asia may be most important for the ozone change.
Ozone levels across much of North America and Europe dropped significantly between 2000 and 2014. People living in parts of southern Europe, South Korea and southern Japan and China also experienced more than 15 days a year of ozone levels above 70 ppb. Trends in daily maximum ozone levels (known as 4MDA8) at urban and non-urban sites.
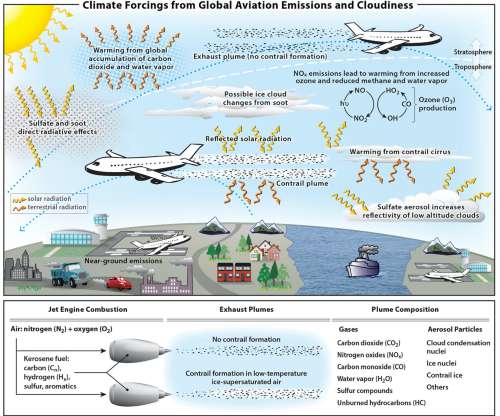
of the human-made climate impact; two-thirds of this impact are caused by emissions other than CO 2 , according to a new study by researchers in Europe and the US. This new study is based on a thorough review of a decade of research on aviation emissions. The formation and emission of sulfate aerosol yields a negative (cooling) term.
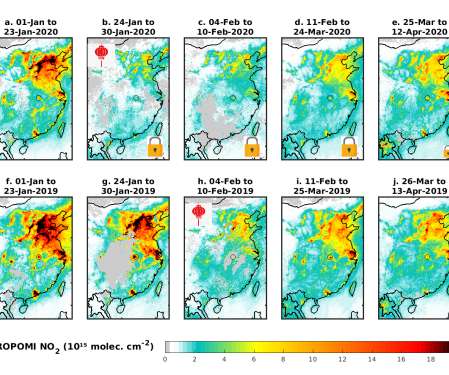
Levels of two major air pollutants have been reduced significantly since lockdowns began in response to the COVID-19 pandemic, but a secondary pollutant—ground-level ozone—has increased in China, according to new research. Maybe this unintended experiment could be used to understand better the emission regulations.
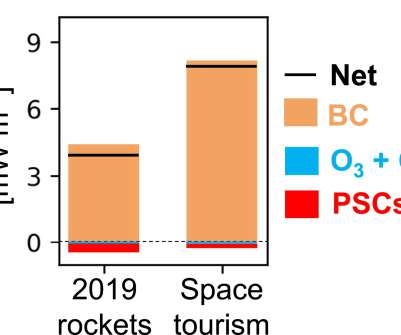
The rapidly growing space industry may have a greater climate effect than the aviation industry and undo repair to the protective ozone layer if left unregulated, according to a new study led by UCL and published in the journal Earth’s Future as an open-access paper. The space industry is one of the world’s fastest growing sectors.
Springtime ozone distributions for 1984, 1995–2008 in the mid-troposphere (3.0–8.0 Springtime ozone levels above western North America are rising primarily due to air flowing eastward from the Pacific Ocean, a trend that is largest when the air originates in Asia. The US EPA recently proposed new tougher ground-level ozone standards.
A study by an international team led by scientists at the University of East Anglia have identified four new man-made gases in the atmosphere, all of which are contributing to the destruction of the ozone layer. Emission increases of this scale have not been seen for any other CFCs since controls were introduced during the 1990s.
have developed a simulator able to predict tropospheric ozone concentrations across the whole of South and East Asia. Tropospheric ozone is the main cause of photochemical smog, an atmospheric pollutant harmful to human health and plant growth. Toyota Motor Corporation (TMC) and Toyota Central R&D Labs.,
Emissions of one of the chemicals most responsible for the Antarctic ozone hole are on the rise, despite an international treaty that required an end to its production in 2010, a new study by researchers at NOAA and their colleagues shows. However, that decrease is significantly slower than it would be without the new CFC emissions.
Global benefits from full implementation of the identified measures in 2030 compared to the reference scenario. Black carbon and tropospheric ozone are harmful air pollutants that also contribute to climate change. Full implementation of these measures would reduce future global warming by 0.5 °C Click to enlarge.
In China, people breathe ozone-laden air two to six times more often than people in the United States, Europe, Japan, or South Korea, according to a new international study published in Environmental Science & Technology Letters. 2017 for one ozone metric. The inset shows ozone trends in Beijing (red) and Los Angeles (blue).
The decrease in CO 2 equivalent emissions of ODSs (ozone-depleting substances: CFCs, halons, HCFCs, and others) may be offset by the projected increase in their non-ozone depleting substitutes (HFCs) (lines designated as HFC scenarios). Climate and the Ozone Layer. Source: UNEP. Click to enlarge.
Global levels of the hydrocarbons ethane and propane in the atmosphere have been underestimated by more than 50%, according to a new study by a team of scientists from Europe and the US. Levels of ethane and propane declined in many places the 1980s and 1990s, but global growth in demand for natural gas means these trends may be reversing.
The Health Effects Institute (HEI) has launched two new studies funded under RFA 21-1, Quantifying Real-World Impacts of Non-Tailpipe Particulate Matter Emissions. The new studies are: Improved Characterization of the Real-World Contributions and Impacts of Non-tailpipe Particulate Matter Emissions ,” led by Greg Evans, University of Toronto.
Comparison of annual N 2 O ODP-weighted emissions from the 1990s with emissions of other ODS in 1987 and in 2008. Even at the height of ODS emissions in the 1980s, annual anthropogenic N 2 O emissions were the fourth most significant. About one-third of global nitrous oxide emissions are from human activities.
Relying more on natural gas would reduce emissions of carbon dioxide, but it would do little to help solve the climate problem. It would be many decades before it would slow down global warming at all, and even then it would just be making a difference around the edges. —Tom Wigley. —Tom Wigley. degree Celsius).
Illustration of projected ozone changes in the South Coast region due to climate change in 2050. Areas in orange and red could see ozone concentrations elevated by 9 to 18 parts per billion. These narrow-focused models utilize high-resolution information about the geography, meteorology and emissions of these areas.
Researchers at Tohoku University in Japan have identified a way to reduce harmful NO emissions produced by ammonia fuel during combustion. Although the space and time-averaged emission (STAE) of NO was found to decrease with increase in the global equivalence ratio (global ?)
Exposure to ozone, long associated with impaired lung function, is also connected to health changes that can cause cardiovascular disease such as heart attack, high blood pressure and stroke, according to a new study of Chinese adults. The findings associated ozone exposure with markers of platelet activation and increased blood pressure.
Shipping-induced global temperature change in 2050 using different parameterizations of Indirect Aerosol Effect (IAE). A recent study commissioned by the International Maritime Organization (IMO) estimated total emissions of 1046 Tg CO 2 yr ?1 of the total anthropogenic CO 2 emissions in that year. Credit: ACS, Lund et al.
However, emissions do not just remain in conurbations; particles and gaseous pollutants can be transported thousands of kilometers by the wind. The University of Bremen is the scientific base of the international project known as EMeRGe (Effect of Megacities on the transport and transformation of pollutants on the Regional and Global scales).
A new study by researchers at MIT has found that factoring the non-CO 2 combustion emissions and effects into the lifecycle of a Synthetic Paraffinic Kerosene (SPK) aviation fuel can lead to a decrease in the relative environmental merit of the SPK fuel compared to conventional jet fuel. Aviation climate change impacts pathway.
CSIRO scientists have developed a new way to account for ozone in computer simulations of the climate. This latest modeling shows that the oceans take much less ozone out of the atmosphere than previously thought. Ozone (O 3 ) is formed by reactions of chemicals such as nitrogen oxides and volatile organic compounds—i.e.,
Following this BAU scenario, the researchers projected that air quality for the global average citizen in 2050 would be almost comparable to that for the average citizen in East Asia in the year 2005—an outcome which underscores the need to pursue emission reductions, according to the authors. Resources. Zimmermann, U.M.
Ethane reacts with sunlight and other molecules in the atmosphere to form ozone, which at the surface can cause respiratory problems, eye irritation and other ailments and damage crops. Two percent might not sound like a lot, but the emissions we observed in this single region are 10 to 100 times larger than reported in inventories.
In its recently released Inventory of US Greenhouse Gas Emissions and Sinks: 1990 – 2011 ( earlier post ), the US Environmental Protection Agency (EPA) reported that methane (CH 4 ) emissions from the field production of natural gas have declined by 36% from 2007 to 2011 (from 83.1 a global warming potential of 21.
Led by the tiny Pacific island of the Federated States of Micronesia, a growing group of low-lying islands and other vulnerable countries are calling for fast action on the approximately 50% of global warming that is caused by pollutants other than carbon dioxide (CO 2 ). The next round of UN climate negotiations begins in Cancun today.
The global market for rocket launches may require more stringent regulation in order to prevent significant damage to Earth’s stratospheric ozone layer in the decades to come, according to a new study by researchers in California and Colorado. Darin Toohey.
Emission standard. Renault selected six environmental indicators for the LCA: Global Warming 100yr Potential (kg CO 2 equivalent). in the atmosphere and consequently of global warming potential. in the atmosphere and consequently of global warming potential. Photochemical Ozone Creation Potential (kg Ethene equivalent).
Ozone pollution near Earth’s surface is one of the main ingredients of summertime smog. It is also not directly measurable from space due to the abundance of ozone higher in the atmosphere, which obscures measurements of surface ozone. —Jin et al.
US Congressman Scott Peters (CA-52) introduced the Super Pollutant Emissions Reduction Act (SUPER Act) of 2013, legislation aimed at combating short-lived climate pollutants, which are only somewhat addressed by disparate government programs. C in projected cumulative warming by 2050 and 1.1 °C
A team from Duke University in the US and University of York in the UK have utilized a novel method to estimate long-term ozone exposure and previously reported epidemiological results to quantify the health burden from long-term ozone exposure in three major regions of the world. —Karl Seltzer. Karl M Seltzer et al.
Despite reports that globalemissions of the potent greenhouse gas, HFC-23, were almost eliminated in 2017, an international team of scientists, led by the University of Bristol, has found atmospheric levels growing at record values. As a result, they reported that they had almost completely eliminated HFC-23 emissions by 2017.
The US, Canada, and Mexico have submitted a proposal to strengthen climate protection under the Montreal Protocol— the international treaty that phases out the production of a number of substances responsible for ozone depletion. The proposal targets the production and use of HFCs, a group of “super” greenhouse gases. Source: IGSD.
As California continues to reduce local sources of ozone, ozone entering the state from the Pacific makes up a larger fraction of measured ozone levels. An ozonesonde is a balloon which measures ozone from the surface to more than 10 kilometers above the ground.
positive or negative—and magnitude of net climate forcing from BC emissions), currently available scientific and technical information provides a strong foundation for making mitigation decisions to achieve lasting benefits for public health, the environment, and climate. emissions in 2005. Earlier post.). Source: EPA.
While they do not deplete the ozone layer, many are highly potent greenhouse gases whose use is growing rapidly as replacements for ozone-depleting substances being phased out under the Montreal Protocol. Left unabated, HFC emissions could grow to nearly 20% of carbon dioxide emissions by 2050, a serious climate mitigation concern.
The California Air Resources Board’s latest state inventory of greenhouse gas emissions shows that California’s GHG emissions continue to decrease. Trends in California GHG Emissions. Changes in emissions by Scoping Plan sector between 2000 and 2017. Emissions are organized by the categories in the AB 32 Scoping Plan.
Decomposition of the decadal change in total global CO 2 emissions from fossil fuel combustion by four driving factors; population, income (GDP) per capita, energy intensity of GDP and carbon intensity of energy. Total anthropogenic GHG emissions were the highest in human history from 2000 to 2010 and reached 49 (±4.5)
Globalozone-depleting substances (ODSs) and HFC emissions (A), global CO 2 and HFC emissions (B), and ODS, HFC, and CO 2 global RF (C) for the period 2000–2050. These HFCs, gases used in refrigerators and air conditioners, are substitutes for ozone-depleting gases, but they are also strong greenhouse gases.
A global phase down of HFCs could potentially reduce some 90 gigatons of CO 2 equivalent by 2050, equal to roughly two years worth of current global greenhouse gas emissions. While they do not deplete the ozone layer, many are highly potent greenhouse gases.
On a per-storage basis, the team found that the NiMH technology was found to have the highest environmental impact, followed by NCM and then LFP, for all categories considered except ozone depletion potential. They also found higher life cycle global warming emissions than have been previously reported.
We organize all of the trending information in your field so you don't have to. Join 5,000+ users and stay up to date on the latest articles your peers are reading.
You know about us, now we want to get to know you!
Let's personalize your content
Let's get even more personalized
We recognize your account from another site in our network, please click 'Send Email' below to continue with verifying your account and setting a password.


Let's personalize your content