Remove Cleaner Remove Coal Remove Emissions Remove Solar
article thumbnail

As states continue to use less coal for electricity, driving electric vehicles becomes even cleaner

Green Car Congress

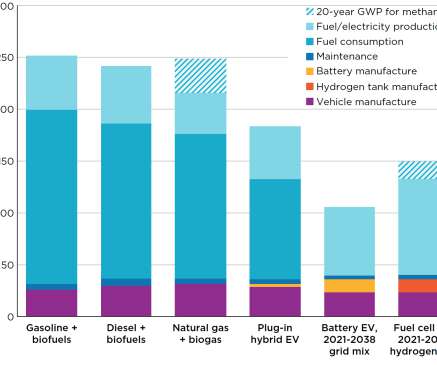
The calculated relative amounts of well-to-wheels emissions of greenhouse gases from eight different energy sources are shown in the table below. These results indicate that coal and oil are the energy sources leading to most emissions, and that hydro, wind, and nuclear are the energy sources leading to least emissions.

Coal 334
article thumbnail

BloombergNEF: clean energy investment in developing nations slumps as financing in China slows; coal burn surges to record high

Green Car Congress

New investment in wind, solar, and other clean energy projects in developing nations dropped sharply in 2018, largely due to a slowdown in China. The findings suggest that developing nations are moving toward cleaner power but not nearly fast enough to limit global CO 2 emissions. thousand terawatt-hours in 2018, up from 6.4

Coal 243
article thumbnail

Gas prices due to drop in 2024, as EVs plug into cleaner energy

Baua Electric

Energy Information Administration (EIA) expects combined electricity generation from solar and wind to exceed coal for the first time in 2024. Solar alone is expected to increase 39% from 2023 thanks to continual increases in generating capacity, according to the EIA. Offshore wind farm And as noticed by Ars Technica , the U.S.

Cleaner 52
article thumbnail

Dominion Energy sets new goal of net zero emissions by 2050 for both power generation, natural gas operations

Green Car Congress

Dominion Energy announced a significant expansion of the company's greenhouse gas emissions-reduction goals, establishing a new commitment to achieve net zero emissions by 2050. The goal covers carbon dioxide and methane emissions, the dominant greenhouse gases, from both electricity generation and gas infrastructure operations.

Emissions 207
article thumbnail

ICCT LCA study finds only battery and hydrogen fuel-cell EVs have potential to be very low-GHG passenger vehicle pathways

Green Car Congress

The ICCT has conducted a comprehensive global and temporal life-cycle assessment of GHG emissions from a variety of alternative passenger car powertrains and fuels. The life-cycle GHG emissions of cars registered in 2021 are compared with those of cars expected to be registered in 2030. Source: The ICCT.

Hydrogen 418
article thumbnail

DOE: US average EV CO2e/year is 4,815 lbs, vs. 11,435 lbs for average gasoline car

Green Car Congress

Although all-electric vehicles (EVs) produce zero tailpipe emissions, there are upstream emissions of greenhouse gases from electricity production. Using electricity production data by source and state, the DOE’s Alternative Fuels Data Center has estimated the annual carbon dioxide (CO 2 e)-equivalent emissions of a typical EV.

Gasoline 313
article thumbnail

California ARB: GHG emissions fell below 1990 levels for first time in 2016; down 13% from 2004 peak; transportation emissions up 2%

Green Car Congress

The California Air Resources Board (CARB) announced that greenhouse gas emissions in California in 2016 fell below 1990 levels for the first time since emissions peaked in 2004—a reduction roughly equivalent to taking 12 million cars off the road or saving 6 billion gallons of gasoline a year.

2004 225