
York study: Less traffic in first UK lockdown reduced NO2 pollution but caused increase in surface ozone
Green Car Congress
DECEMBER 27, 2020
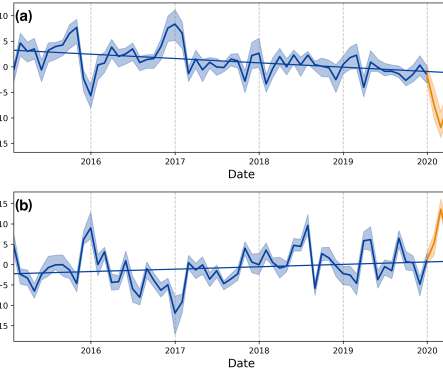
Mean relative change of deseasonalized UK values of (a) NO 2 and (b) O 3 for all urban background and traffic sites from 2015 to 2020, with the mean 2015–2019 trend superimposed. Data from 2020 are shown in orange, with the red dashed line denoting the start of the lockdown on 23 March 2020. These results are a cautionary tale.


Let's personalize your content