Remove 2015 Remove CO2 Remove Diesel Remove Gasoline
article thumbnail

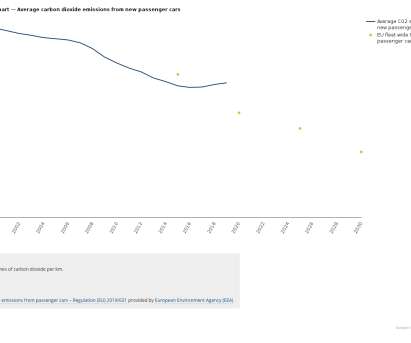
JATO: European new car CO2 emissions highest average since 2014; shift from diesel to gasoline and SUVs rise

Green Car Congress

The analysis covered 23 markets in Europe and found a direct correlation between diesel car registrations and average CO2 emissions. With increased negative public perception towards diesels, combined with new government regulations such as WLTP and scrutiny of the fuel type, demand for diesel fell by 18% in 2018.

Diesel 236
article thumbnail

EEA final data shows average car CO2 emissions in Europe kept increasing in 2019

Green Car Congress

Most new SUVs registered were gasoline vehicles, with average emissions of 134 g CO 2 /km, which is around 13 g CO 2 /km higher than other new gasoline cars. In 2019, as in 2018, gasoline cars were the most sold passenger vehicles, constituting 59% of all new registrations. Diesel vehicles constituted 31% of new registrations.

2019 259
article thumbnail

Renewable-methanol fueled Geely cars in fleet testing in Iceland; 70% reduction in WTW CO2 compared to gasoline

Green Car Congress

million investment in 2015) in Carbon Recycling International ( CRI ), an Icelandic company which produces renewable methanol using recycled CO 2 emissions sourced from a local thermal power plant and hydrogen made by splitting water with electrolysis (Power-to-Methanol). The switch from gasoline to methanol is not noticeable to the driver.

Iceland 170
article thumbnail

New report finds global CO2 vehicle emission reduction measures falter; dropping diesels, increasing SUVs

Green Car Congress

Average new LDV fuel economy (liters gasoline equivalent per 100 km (L ge /100 km) by country or region (2005-17) and new registrations (2017). per year between 2015 and 2017. A total of 27 countries—including Sweden, Canada and the United Kingdom—saw the fuel economy of their fleets stagnate or worsen from 2015 to 2017.

Global 308
article thumbnail

EIA: US energy-related CO2 dropped 2.7% in 2015; of end-use sectors, only transportation increased

Green Car Congress

According to a report from the US Energy Information Administration (EIA), US energy-related CO 2 emissions decreased by 146 million metric tons (MMmt) in 2015 to 5,259 MMmt, down 2.7% Energy-related CO 2 emissions in 2015 were about 12% below 2005 levels. —“US Energy-Related Carbon Dioxide Emissions, 2015”. Electricity.

2015 150
article thumbnail

New cars in Europe in 2013 collectively met 2015 CO2 target two years ahead of the deadline

Green Car Congress

2015 target: 130 g CO 2 /km. The average CO 2 emissions level of a new car sold in 2013 was 127 g CO 2 /km; the target for 2015 was 130 g/km. Thus, in 2013 the European Union fleet already collectively met its legal target for 2015. The average per-km CO 2 emissions for gasoline-fueled cars was 128.62 Source: EEA.

2013 231
article thumbnail

EIA: US energy-related CO2 emissions down 1.7% in 2016; carbon intensity of economy down 3.1%; transportation emissions up

Green Car Congress

US energy-related CO 2 emissions decreased by 89 million metric tons (MMmt), from 5,259 MMmt in 2015 to 5,170 MMmt in 2016. decline in energy-related CO2, according to the latest report from the US Energy Information Administration (EIA). Since the late 1990s, the transportation sector has produced the most CO2 emissions.

2016 150