This site uses cookies to improve your experience. To help us insure we adhere to various privacy regulations, please select your country/region of residence. If you do not select a country, we will assume you are from the United States. Select your Cookie Settings or view our Privacy Policy and Terms of Use.
Cookie Settings
Cookies and similar technologies are used on this website for proper function of the website, for tracking performance analytics and for marketing purposes. We and some of our third-party providers may use cookie data for various purposes. Please review the cookie settings below and choose your preference.
Used for the proper function of the website
Used for monitoring website traffic and interactions
Cookie Settings
Cookies and similar technologies are used on this website for proper function of the website, for tracking performance analytics and for marketing purposes. We and some of our third-party providers may use cookie data for various purposes. Please review the cookie settings below and choose your preference.
Strictly Necessary: Used for the proper function of the website
Performance/Analytics: Used for monitoring website traffic and interactions
Black carbon emissions and BC emissions intensity per year. A study led by a team from Peking University has estimated that global black carbon (BC) emissions increased from 5.3 teragrams per year in 2007 (+72%). Among their findings: The residential sector is the most important anthropogenic BC emission source.
In its recently released Inventory of US Greenhouse Gas Emissions and Sinks: 1990 – 2011 ( earlier post ), the US Environmental Protection Agency (EPA) reported that methane (CH 4 ) emissions from the field production of natural gas have declined by 36% from 2007 to 2011 (from 83.1 CH 4 emissions represented 8.8%
L/100km), according to data from the University of Michigan Transportation Research Institute (UMTRI)—up 18% from the value in October 2007 (the first month of UMTRI monitoring). The Eco-Driving Index (EDI)—an index that estimates the average monthly emissions generated by an individual US driver—stood at 0.87
Starting immediately, Deutsche Post is offsetting any unavoidable CO 2 emissions due to mail transport with investments in internationally recognized and certified climate protection projects at no extra charge. For the last ten years, DHL has transported all parcels for private customers with its climate-friendly “GoGreen” service.
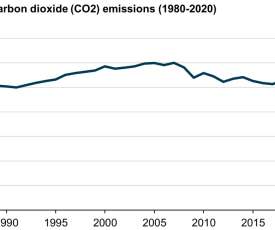
US electric power sector CO 2 emissions have declined 28% since 2005 because of slower electricity demand growth and changes in the mix of fuels used to generate electricity, according to the US Energy Information Administration (EIA). Source: US EIA, US Energy-Related Carbon Dioxide Emissions , 2017.
2010 engines emissions reduction relative to 2010, 2007, and 2004 US emission standards. The study, the Phase 2 Report of the comprehensive Advanced Collaborative Emissions Study (ACES). The study, the Phase 2 Report of the comprehensive Advanced Collaborative Emissions Study (ACES). Source: CRC. Click to enlarge.
The funds will support the deployment of thousands of zero-emission trucks, school buses and transit buses to deliver clean air benefits to communities hit hardest by the impacts of pollution from medium- and heavy-duty vehicles. The California Energy Commission (CEC) approved a $2.9-billion
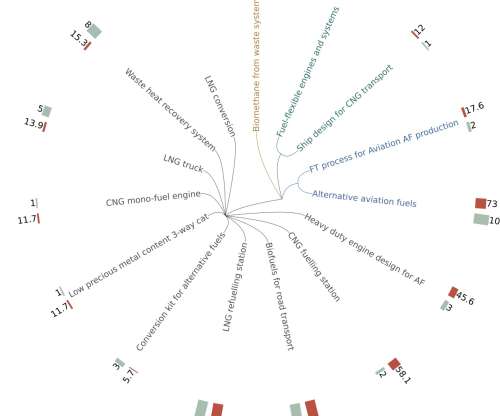
The European Commission’s Joint Research Center recently published a report analyzing research and innovation (R&I) in low-emission alternative energy for transport in Europe. This specifically involves tank-to-wheel energy and emissions (i.e. Transport infrastructure (INF). Top 15 technologies for the ALT roadmap.
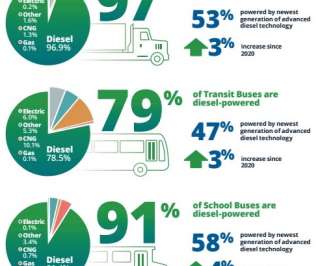
of diesels on the road are 2007—meaning they are equipped with at least a diesel particulate filter. For gasoline vehicles that make up about a quarter of all commercial trucks (Class 3-8), more than half (57.5%) of those in operation are 2007 and newer model years. For the largest commercial trucks (Class 8), 62.5%
of global CO2 emissions. This makes the sector pivotal in bringing down global emissions. Already, Maersk’s relative CO 2 emissions (CO 2 emissions per container moved) have been reduced by 46% (baseline 2007), approximately 9% more than the shipping industry average.
greenhouse gas emissions were 6,472.3 The decrease in total greenhouse gas emissions between 2016 and 2017 was driven in part by a decrease in CO 2 emissions from fossil fuel combustion. Relative to the 1990 baseline, gross emissions in 2017 were higher by 1.6%, down from a high of 15.7% above 1990 levels in 2007.
million in Diesel Emission Reduction Act (DERA) grants to public and private partners in California. Cajon Valley Union School District (CVUSD) in San Diego received $1,000,000 to replace five school buses with zero emission battery-electric buses. The US Environmental Protection Agency (EPA) awarded $9.6
The US Energy Information Administration (EIA) forecasts that US energy-related carbon dioxide (CO 2 ) emissions will decline by 11% in 2020. In EIA’s latest Short-Term Energy Outlook , US energy-related CO 2 emissions are forecast to fall more than the 5% decline in gross domestic product (GDP) in 2020. Source: U.S. Source: U.S.
When peat swamps are drained for agriculture, the peat begins to decompose, and is an enormous source of carbon emissions. Mha (20%) of the peatlands of Peninsular Malaysia, Sumatra and Borneo in 2010, surpassing the area of Belgium and causing an annual carbon emission from peat decomposition of 230–310 Mt CO 2 e. Earlier post.).
Analysis of a study by S&P Global Mobility shows the number of new near-zero emission diesel trucks on the road in the US increased 10.2% Near-zero emission trucks are advanced diesel technology manufactured in the 2010 and later model years. The population of near-zero emissions diesel technology trucks is growing. That’s a 10.2%
The result is a set of usable conversion factors for distance-based CO 2 emissions among the different driving cycles. This study updates and refines an earlier analysis completed in 2007. CO 2 emissions under the JC08, US CAFE and NEDC regimes are 18%, 15% and 13% lower. WLTC will be replacing NEDC in a few years.).
US transit agencies are adopting lower-emissions diesel technology at a faster percentage than the heavy-duty trucking fleet, said Ezra Finkin, the Director of Policy for the Diesel Technology Forum, at last week’s American Public Transportation Association (APTA) Expo Bus and Maintenance Technical Session in Houston. —Ezra Finkin.
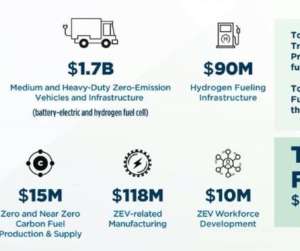
The California Energy Commission (CEC) approved a $95-million plan for critical clean transportation investments to expedite the adoption of zero-emission vehicles (ZEVs) and help the state reach its climate, air quality and other goals. million for ZEVs, as well as zero-emission infrastructure and related workforce development.
The global economic recession of 2008—which severely depressed light-duty vehicle sales—resulted in an increase in the age of the light-duty vehicle fleet in the US that likely slowed the rate of decrease of fleet average emissions, according to a study by Gary Bishop and Donald Stedman at the University of Denver.
Although China and India remain the world’s largest consumers of coal, a new University of Maryland-led study found that China’s sulfur dioxide emissions fell by 75% since 2007, while India’s emissions increased by 50%. The rapid decrease of sulfur dioxide emissions in China far exceeds expectations and projections.
The hydrogen station, built to fuel Orange County Transportation Authority (OCTA) buses, will fill up a transit bus in six to 10 minutes, similar to diesel or CNG bus filling rates, making this the only zero-emission fuel choice that allows fleets to operate as usual.
US energy-related CO 2 emissions in 2012 were the lowest since 1994, at 5.3 With the exception of 2010, emissions have declined every year since 2007. The largest drop in emissions in 2012 came from coal, which is used almost exclusively for electricity generation. Duke study.
The Mayor of London, Sadiq Khan, will expand the Ultra Low Emission Zone (ULEZ) ( earlier post ) London-wide. The expansion will come into effect on 29 August 2023 and will operate across all London boroughs up to the existing Low Emission Zone boundary for large and heavy vehicles. Source: Transport for London. daily charge.
million in a settlement with the US Environmental Protection Agency (EPA) and the US Department of Justice (DOJ) to resolve alleged violations of the Clean Air Act for selling heavy-duty diesel engines that were not certified by EPA and did not meet applicable emission standards. Detroit Diesel will pay $28.5 Detroit Diesel Corp.
mpg since October 2007 (the first month of their monitoring). The University of Michigan Eco-Driving Index (EDI)—an index that estimates the average monthly emissions of greenhouse gases generated by an individual US driver—stood at 0.80 This value indicates an improvement of 20% since October 2007. l/100km), up 0.2
A study of motor vehicle emissions by researchers at UC Berkeley found that running CO and evaporative and tailpipe NMHC emissions from gasoline-powered vehicles in three major US urban centers (NY, LA and Houston) have decreased by almost an order of magnitude over the last twenty years, despite increases in fuel use.
Vehicle efficiency improvements via effective standards and policies could reduce annual CO 2 e emissions from the US, China, and the EU by 1.3 The US, China, and the EU could reduce their combined annual CO 2 emissions by 1.3 Similar policies can trigger comparable innovations to reduce greenhouse gas emissions, they suggest.
The California Air Resources Board’s latest state inventory of greenhouse gas emissions shows that California’s GHG emissions continue to decrease. Trends in California GHG Emissions. Changes in emissions by Scoping Plan sector between 2000 and 2017. Emissions are organized by the categories in the AB 32 Scoping Plan.
Global CO 2 emissions from fossil fuel use and cement production reached a new all-time high in 2013, according to the annual report “Trends in global CO2 emissions”, released by PBL Netherlands Environmental Assessment Agency and the European Joint Research Centre (JRC). In 2013, global CO 2 emissions grew to the new record of 35.3
An analysis by JATO Dynamics has found that average new vehicle CO 2 emissions in European increased in 2018, with the total average increasing by 2.4 The analysis covered 23 markets in Europe and found a direct correlation between diesel car registrations and average CO2 emissions. The emissions averages for SUVs worsened by 1.4
Neste has been exploring ways to contribute to improving palm oil industry’s environmental performance, particularly how to further reduce greenhouse gas emission from palm oil production. In 2015, Neste initiated a two-year study project to verify the methane emission reduction for a newly applied effluent treatment method.
Decomposition of the decadal change in total global CO 2 emissions from fossil fuel combustion by four driving factors; population, income (GDP) per capita, energy intensity of GDP and carbon intensity of energy. Total anthropogenic GHG emissions were the highest in human history from 2000 to 2010 and reached 49 (±4.5) IPCC WG III.
The rule requires container, passenger and refrigerated cargo ships to reduce emissions while docked at California’s busiest ports, including Los Angeles, Long Beach, Oakland, Hueneme, San Francisco and San Diego. The violations were discovered during routine audits of the company’s 2017 and 2018 vessel fleet visits to the Port of Oakland.
km-resolution MISR aerosol properties over Southern California for years 2001–2003, 2007–2009 and 2013–2015. Maps of 3-year averaged PM 2.5 sulfate, nitrate, OC and EC concentrations estimated using 4.4 LA=Los Angeles basin, CV=Central Valley, OC=Organic Carbon, EC=Elemental Carbon. Click to enlarge.
Adjusted CO 2 emissions and adjusted fuel economy, MY 1975-2011. The report finds that CO 2 emissions rates and fuel economy values reflect a very favorable multi-year trend beginning in MY 2005. The fleet-wide average real world MY 2011 personal vehicle CO 2 emissions value is 398 g/mi and average fuel economy is 22.4
mpg from the value in October 2007, the first month of their monitoring. The University of Michigan Eco-Driving Index (EDI)—an index that estimates the average monthly emissions of greenhouse gases generated by an individual US driver—reached a record low of 0.79 The January 2014 fuel economy figure is up 4.8
mpg since their first month of monitoring in October 2007. The University of Michigan Eco-Driving Index (EDI)—an index that estimates the average monthly emissions of greenhouse gases generated by an individual US driver—stood at 0.78 Vehicle fuel economy is up 5.7 in June (the lower the value the better).
mpg or 23% since October 2007 (the first month of their monitoring). The University of Michigan Eco-Driving Index (EDI)—an index that estimates the average monthly emissions of greenhouse gases generated by an individual US driver—stood at 0.80 This value indicates an improvement of 20% since October 2007.
mpg since October 2007 (the first month of their monitoring). The University of Michigan Eco-Driving Index (EDI)—an index that estimates the average monthly emissions of greenhouse gases generated by an individual US driver—edged upward to 0.80 Vehicle fuel economy is up 5.3 Click to enlarge. Click to enlarge.
One high-efficiency combustion concept under investigation is gasoline compression ignition (GCI)—the use of gasoline-like fuels to deliver very low NO x and PM emissions as well as high efficiency in a diesel compression ignition engine. NO x emissions increased as start of second injection command was retarded. Earlier post.)
Bombardier Transportation (now part of Alstom) introduced a variety of green innovations to reduce CO 2 emissions and pollution in the railway sector. This project is a response to the growing demand for emission-free solutions; these five dual-mode battery-catenary trainsets will be used as demonstrators.
Comparison of Hg emissions in 2005 and 2010, by selected sector and region. Unintentional emission sectors: Coal burning, ferrous- and non-ferrous (Au, Cu, Hg, Pb, Zn) metal production, cement production. Intentional-use sectors: Disposal and incineration of product waste, cremation emissions, chlor-alkali industry.
US energy-related CO 2 emissions decreased by 89 million metric tons (MMmt), from 5,259 MMmt in 2015 to 5,170 MMmt in 2016. over that period, other factors contributing to energy-related CO 2 emissions more than offset the growth in GDP, leading to a 1.7% Natural gas CO 2 emissions have increased every year since 2009.
Designed and manufactured in North America, DuraFit DPFs are cost-effective, exact-fit alternatives to OEM replacements, meet or exceed OEM emission requirements, and are fully supported by CDTi’s nationwide distributor network and field application specialists. Clean Diesel Technologies, Inc. Sales of CDTi’s DuraFit™DPFs commenced in June.
We organize all of the trending information in your field so you don't have to. Join 5,000+ users and stay up to date on the latest articles your peers are reading.
You know about us, now we want to get to know you!
Let's personalize your content
Let's get even more personalized
We recognize your account from another site in our network, please click 'Send Email' below to continue with verifying your account and setting a password.


Let's personalize your content