article thumbnail

Actual fuel economy of cars and light trucks: 1966-2019

Green Car Congress

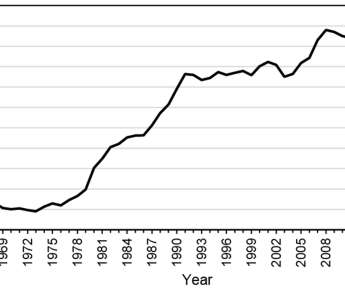
vehicle fuel economy. Specifically, this study examines actual fuel economy of cars and light trucks (pickup trucks, SUVs, and vans) from 1966 through 2019. (My Calculated vehicle fuel economy is available going back to 1923. The graph below shows the changes in actual vehicle fuel economy from 1966 through 2019.

article thumbnail

Gasoline consumption per capita in 2020 was on par with that in 1965

Green Car Congress

This analysis examines the effect of this downturn in driving on gasoline consumption (both total and per capita), and places the consumption in 2020 in a historical context. The results show that gasoline consumption per capita in 2020 was on par with that 55 years ago. Total consumption. Total consumption (millions of gallons).

2020 415
article thumbnail

Actual fuel economy of cars and light trucks: 1966-2017

Green Car Congress

vehicle fuel economy. Specifically, this study examines actual fuel economy of cars and light trucks (pickup trucks, SUVs, and vans) from 1966 through 2017. Calculated vehicle fuel economy is available going back to 1923. For 1966 through 1985, fuel economy was calculated from the information in a summary publication by the U.S.

article thumbnail

EPA’s annual automotive trends report shows slight increase in fuel economy from MY2017 to MY2018

Green Car Congress

In the US, Model Year (MY) 2018 vehicle fuel economy was 25.1 Since MY 2004, CO 2 emissions have decreased 23%, or 108 g/mi, and fuel economy has increased 30%, or 5.8 Average estimated real-world CO 2 emissions are projected to fall 6 g/mi to 346 g/mi and fuel economy is projected to increase 0.4 miles per gallon, 0.8%

article thumbnail

EPA fuel economy report finds weight and power leveling off, footprint stable

Green Car Congress

EPA recently released the latest edition of its annual report Light-Duty Automotive Technology, Carbon Dioxide Emissions and Fuel Economy Trends. The report is the authoritative reference for real-world fuel economy, technology trends and tailpipe carbon dioxide emissions, for new personal vehicles sold in the US every year since 1975.

article thumbnail

California ARB: GHG emissions fell below 1990 levels for first time in 2016; down 13% from 2004 peak; transportation emissions up 2%

Green Car Congress

The California Air Resources Board (CARB) announced that greenhouse gas emissions in California in 2016 fell below 1990 levels for the first time since emissions peaked in 2004—a reduction roughly equivalent to taking 12 million cars off the road or saving 6 billion gallons of gasoline a year.

2004 225
article thumbnail

EPA trends report sees record levels of average new vehicle fuel economy and CO2 emissions for MY 2012; role of new gasoline vehicle technologies

Green Car Congress

EPA projects advanced transmissions (6+ speeds and CVTs), gasoline direct injection (GDI) systems, and turbocharged engines will be installed on at least 15% of all MY 2013 vehicles. The majority of the emissions and fuel savings from current vehicles, EPA noted, is due to new gasoline vehicle technologies. Click to enlarge.