article thumbnail

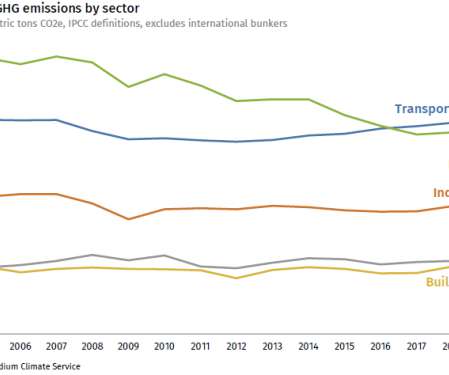
EPA: US GHG emissions in 2017 down 0.3% from 2016

Green Car Congress

greenhouse gas emissions were 6,472.3 from 2016, according to the US Environmental Protection Agency’s (EPA’s) latest Greenhouse Gas Inventory. The decrease in total greenhouse gas emissions between 2016 and 2017 was driven in part by a decrease in CO 2 emissions from fossil fuel combustion.

2017 262
article thumbnail

California ARB: GHG emissions fell below 1990 levels for first time in 2016; down 13% from 2004 peak; transportation emissions up 2%

Green Car Congress

The California Air Resources Board (CARB) announced that greenhouse gas emissions in California in 2016 fell below 1990 levels for the first time since emissions peaked in 2004—a reduction roughly equivalent to taking 12 million cars off the road or saving 6 billion gallons of gasoline a year.

2004 225
article thumbnail

Carbon emissions in port of Rotterdam drop more swiftly than national average

Green Car Congress

In the period 2016-2020, the port of Rotterdam reduced its total carbon emissions by 27%. In 2020, Rotterdam achieved a 12% reduction in emissions, compared to 8% in the Netherlands as a whole. of the Netherlands’ total carbon emissions: a share that several years ago was 16%.

Carbon 259
article thumbnail

California 2017 GHG inventory shows 1.2% total drop from 2016; transportation sector emissions up 1%

Green Car Congress

The California Air Resources Board’s latest state inventory of greenhouse gas emissions shows that California’s GHG emissions continue to decrease. Compared to 2016, California’s GDP grew 3.6% Trends in California GHG Emissions. Changes in emissions by Scoping Plan sector between 2000 and 2017. Source: ARB.

2017 230
article thumbnail

EIA: CO2 emissions from US power sector have declined 28% since 2005

Green Car Congress

US electric power sector CO 2 emissions have declined 28% since 2005 because of slower electricity demand growth and changes in the mix of fuels used to generate electricity, according to the US Energy Information Administration (EIA). Source: US EIA, US Energy-Related Carbon Dioxide Emissions , 2017.

2005 414
article thumbnail

EIA: US energy-related CO2 emissions down 1.7% in 2016; carbon intensity of economy down 3.1%; transportation emissions up

Green Car Congress

US energy-related CO 2 emissions decreased by 89 million metric tons (MMmt), from 5,259 MMmt in 2015 to 5,170 MMmt in 2016. over that period, other factors contributing to energy-related CO 2 emissions more than offset the growth in GDP, leading to a 1.7% Natural gas CO 2 emissions have increased every year since 2009.

2016 150
article thumbnail

IEA finds CO2 emissions flat for third straight year even as global economy grew in 2016

Green Car Congress

Global energy-related carbon dioxide emissions were flat for a third straight year in 2016 even as the global economy grew, according to the International Energy Agency. The data signal a continuing decoupling of emissions and economic activity. Global emissions from the energy sector stood at 32.1

Economy 199