Remove 2016 Remove All-Electric Remove Climate Remove Gasoline-Electric
article thumbnail

EPA: US GHG emissions in 2017 down 0.3% from 2016

Green Car Congress

from 2016, according to the US Environmental Protection Agency’s (EPA’s) latest Greenhouse Gas Inventory. The decrease in total greenhouse gas emissions between 2016 and 2017 was driven in part by a decrease in CO 2 emissions from fossil fuel combustion. In 2017, total gross U.S. greenhouse gas emissions were 6,472.3 below 2005 levels.

2017 262
article thumbnail

EEA report: EVs are better for climate and air quality

Green Car Congress

Battery electric cars emit less greenhouse gases and air pollutants over their entire life cycle than petrol and diesel cars, according to a European Environment Agency (EEA) report. Emissions are usually higher in the production phase of electric cars, but these are more than offset by lower emissions in the use phase over time.

Climate 268
article thumbnail

California ARB: GHG emissions fell below 1990 levels for first time in 2016; down 13% from 2004 peak; transportation emissions up 2%

Green Car Congress

The California Air Resources Board (CARB) announced that greenhouse gas emissions in California in 2016 fell below 1990 levels for the first time since emissions peaked in 2004—a reduction roughly equivalent to taking 12 million cars off the road or saving 6 billion gallons of gasoline a year.

2004 225
article thumbnail

2016 Chevrolet Volt EPA-rated at 53 miles all-electric range

Green Car Congress

The Chevrolet Volt’s all-new second-generation Voltec extended-range electric propulsion system ( earlier post ) delivers 53 miles (85 km) of all-electric range, based on EPA testing. For the first 53 miles, the Gen 2 Volt can drive gas and tailpipe-emissions free using a full charge of electricity stored in its new 18.4-kWh

Volt 150
article thumbnail

California 2017 GHG inventory shows 1.2% total drop from 2016; transportation sector emissions up 1%

Green Car Congress

In 2017, emissions from GHG emitting activities statewide were 424 million metric tons of CO 2 equivalent (MMTCO 2 e), 5 MMTCO 2 e lower than 2016 levels and 7 MMTCO 2 e below the 2020 GHG Limit of 431 MMTCO 2 e. Compared to 2016, California’s GDP grew 3.6% In-State Hydro, Solar, and Wind Electricity Generation.

2017 230
article thumbnail

Ninth annual Green Innovation Index finds California light-duty vehicle emissions spike; major challenge to 2030 climate goals

Green Car Congress

If current rates of decline continue through 2020, the state will need to reduce emissions at a rate of 4.97% each year in the decade between 2020 and 2030, and produce even steeper declines in the period from 2030 to 2050, if it is to meet current climate goals. of emissions and overshadowing all other areas of the economy.

article thumbnail

EIA: US energy-related CO2 fell by 2.8% in 2019, slightly below 2017 levels

Green Car Congress

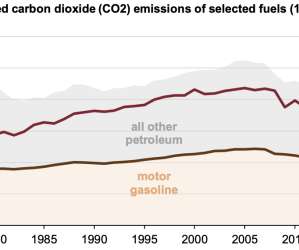
In 2019, CO 2 emissions from petroleum fuels—nearly half of which are associated with motor gasoline consumption—fell by 0.8%, and CO 2 emissions from the use of natural gas increased by 3.3%. The United States now emits less CO 2 from coal than from motor gasoline. Total net electricity generation fell by 1.5%

2019 273