Remove 2011 Remove Coal Remove Electric Remove Wind
article thumbnail

Norwegian startup Blastr plans €4B green steel plant in Finland

Green Car Congress

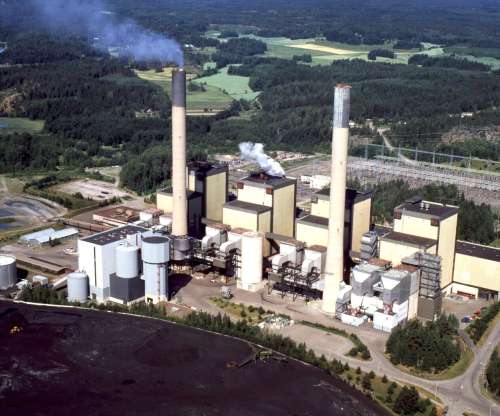
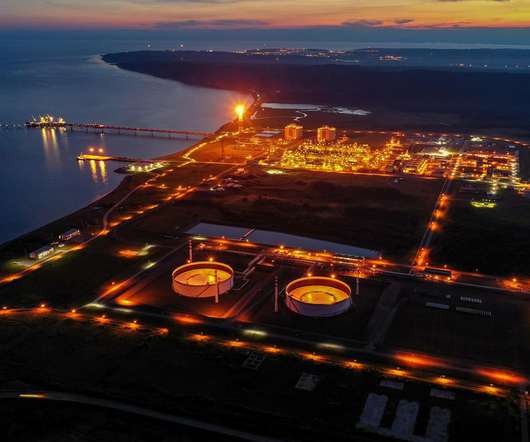
Fortum has developed the Joddböle area since the dismantling of its Inkoo coal-fired power plant there in 2017-2020. The area has excellent conditions for industrial activities: a deep-water harbor and an excellent electricity transmission network. Back then, it was the biggest coal-fired power plant in the Nordic countries.

Finland 437
article thumbnail

Bloomberg NEF forecasts falling battery prices enabling surge in wind and solar to 50% of global generation by 2050

Green Car Congress

This year’s outlook is the first to highlight the significant impact that falling battery costs will have on the electricity mix over the coming decades. BNEF predicts that lithium-ion battery prices, already down by nearly 80% per megawatt-hour since 2010, will continue to tumble as electric vehicle manufacturing builds up through the 2020s.

Wind 220
article thumbnail

EIA: US electricity generation from coal and natural gas both increased with summer heat

Green Car Congress

In August 2012, coal produced 39% of US electricity, up from a low of 32% in April 2012, when the natural gas share of generation equaled that of coal. The August coal share of generation is still notably lower than the 50% annual average over the 1990-2010 period. Data for 2011 and 2012 are preliminary.

Coal 236
article thumbnail

What Are Zero Emission Day and National Drive Electric Week?

Blink Charging

It’s also the kickoff to National Drive Electric Week which runs from September 22 – October 1, 2023. Let’s look at these two annual events and what they mean for current and future electric vehicle (EV) drivers. There are four guidelines to follow: Refrain from using or burning oil, gas or coal. of total U.S.

Emissions 123
article thumbnail

Global CO2 emissions up 3% in 2011; per capita CO2 emissions in China reach EU levels

Green Car Congress

At 3%, the 2011 increase in global CO 2 emissions is above the past decade’s average annual increase of 2.7%. combined, where emissions increased by 9% and 6% respectively in 2011. According to the report, the top emitters contributing to the global 34 billion tonnes of CO 2 in 2011 are: China (29%). the United States (16%).

2011 236
article thumbnail

BP Statistical Review finds global oil share down for 12th year in a row, coal share up to highest level since 1969; renewables at 2%

Green Car Congress

in 2011, close to the historical average. Coal’s market share of 30.3% in 2011, broadly in line with the historical average but well below the 5.1% Coal was again the fastest growing fossil fuel with predictable consequences for carbon emissions; it now accounts for 30.3% World primary energy consumption grew by 2.5%

Coal 261
article thumbnail

Pike Research survey finds erosion in US consumer support for clean energy since 2009; solar energy tops favorables, followed by wind, hybrid vehicles and EVs

Green Car Congress

Percentage of consumers having extremely or very favorable views of 13 clean energy technologies, 2009-2011. Topping the favorables were solar power (77% in 2011, down from 81% in 2009); wind energy (71% in 2011, down from 79% in 2009); and hybrid vehicles (61% in 2011, down from 70% in 2009). Data: Pike Research.

2009 231