Remove CO2 Remove Economy Remove Fuel Economy Remove Green
article thumbnail

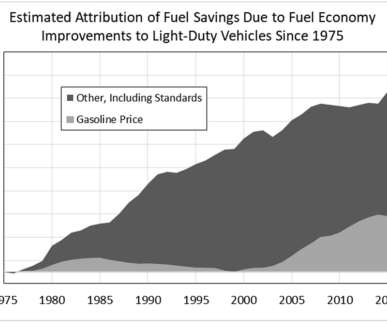
Study estimates fuel economy improvements to US light-duty vehicles from 1975–2018 saved 2T gallons of fuel, 17B tons of CO2

Green Car Congress

A team from the University of Tennessee and the National Renewable Energy Laboratory (NREL) has the fuel savings due to fuel economy improvements over the past 43 years amount to approximately two trillion gallons of gasoline. Greene et al. Fleet-wide fuel economy gains produced large fuel savings.

article thumbnail

EPA trends report finds MY 2021 fuel economy remained flat at a record high while CO2 levels hit new low

Green Car Congress

The US Environmental Protection Agency (EPA) released its annual Automotive Trends Report , which shows that model year (MY) 2021 vehicle fuel economy remained at a record high—but flat with MY 2020 fuel economy—while CO 2 emission levels reached a new record low. Source: EPA. Source: EPA.

article thumbnail

EPA’s annual automotive trends report shows slight increase in fuel economy from MY2017 to MY2018

Green Car Congress

In the US, Model Year (MY) 2018 vehicle fuel economy was 25.1 In model year 2018, the average estimated real-world CO2 emission rate for all new vehicles fell by 4 grams per mile (g/mi) to 353 g/mi, the lowest level measured since 1975, when EPA data collection began. 0 g/mi—and highest fuel economy, at 113.7

article thumbnail

EPA Trends on EVs and PHEVs; beginning of a “measurable and meaningful impact” on new vehicle fuel economy and emissions

Green Car Congress

With alternative fuel vehicles now approaching 1% of new vehicle production, however, they are in fact beginning to have a “ measurable and meaningful impact ” on overall new vehicle fuel economy and CO 2 emissions. In the analysis, EPA uses overall fuel economy in mpg equivalent (mpge) and tailpipe CO 2 emission values.

article thumbnail

EPA annual report on CO2, fuel economy and technology trends finds 2012 heading for all-time best; rapid adoption of new technologies

Green Car Congress

Adjusted CO 2 emissions and adjusted fuel economy, MY 1975-2011. The report finds that CO 2 emissions rates and fuel economy values reflect a very favorable multi-year trend beginning in MY 2005. The fleet-wide average real world MY 2011 personal vehicle CO 2 emissions value is 398 g/mi and average fuel economy is 22.4

article thumbnail

ICCT: incremental technology can cut vehicle CO2 by half and increase fuel economy >60% through 2030 with ~5% increase in price

Green Car Congress

l/100 km) in 2016, the The ICCT team assessed increased consumer label fuel economy (as opposed to the regulatory test fuel economy) to 35 mpg (6.71 The resulting trajectory would reduce CO 2 emissions by half and increase fuel economy by more than 60% from 2016 through 2030.

article thumbnail

EPA trends report sees record levels of average new vehicle fuel economy and CO2 emissions for MY 2012; role of new gasoline vehicle technologies

Green Car Congress

MY 2012 adjusted fuel economy is 23.6 mpg fuel economy improvement from MY 2011 to MY 2012 is the second largest annual improvement in the last 30 years. l/100 km) fuel economy, which, if achieved, will again represent all-time records. Click to enlarge. l/100 km), which is 1.2 mpg, or 22%. Click to enlarge.