Remove 2016 Remove Fuel Remove Gas-Electric Remove Gasoline-Electric
article thumbnail

Argonne releases new cradle-to-grave lifecycle analysis of US LDV vehicle-fuel pathways

Green Car Congress

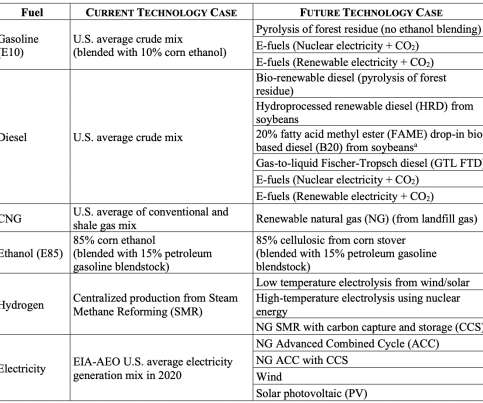
Argonne National Laboratory has published a new cradle-to-grave (C2G) lifecycle analysis (LCA) of US LDV vehicle-fuel pathways. This analysis builds on a previous comprehensive life cycle analysis, updating that study’s 2016 assumptions and methods. Fuel production pathways considered. fuel sales tax) and/or credits (e.g.,

Fuel 417
article thumbnail

EPA: US GHG emissions in 2017 down 0.3% from 2016

Green Car Congress

greenhouse gas emissions were 6,472.3 from 2016, according to the US Environmental Protection Agency’s (EPA’s) latest Greenhouse Gas Inventory. The decrease in total greenhouse gas emissions between 2016 and 2017 was driven in part by a decrease in CO 2 emissions from fossil fuel combustion. Transportation.

2017 262
article thumbnail

Canada publishing final new Clean Fuel Regulations

Green Car Congress

Canada will publish the final Clean Fuel Regulations (CFR) in the Canada Gazette Part II on 6 July 2022. The CFR set increasingly stringent requirements on producers and importers to reduce the carbon intensity of gasoline and diesel. The Clean Fuel Standard will require liquid fossil fuel primary suppliers (i.e.,

Canada 199
article thumbnail

California ARB: GHG emissions fell below 1990 levels for first time in 2016; down 13% from 2004 peak; transportation emissions up 2%

Green Car Congress

The California Air Resources Board (CARB) announced that greenhouse gas emissions in California in 2016 fell below 1990 levels for the first time since emissions peaked in 2004—a reduction roughly equivalent to taking 12 million cars off the road or saving 6 billion gallons of gasoline a year.

2004 225
article thumbnail

California 2017 GHG inventory shows 1.2% total drop from 2016; transportation sector emissions up 1%

Green Car Congress

The California Air Resources Board’s latest state inventory of greenhouse gas emissions shows that California’s GHG emissions continue to decrease. Compared to 2016, California’s GDP grew 3.6% Emissions from gasoline used in on-road vehicles are the main driver of that increase. Trends in California GHG Emissions.

2017 230
article thumbnail

Sales of chargeable vehicles more than triple in EU in Q3 to take 9.9% new market share

Green Car Congress

of passenger cars sold in the EU were electrically-chargeable vehicles, compared to 3.0% Gasoline car sales posted an even stronger drop (-24.3%), going from more than 1.7 This represents a market share of 47.5%, with gasoline going below the mark of 50% for the first time since 2016. In the third quarter of 2020, 9.9%

Market 353
article thumbnail

EIA: US energy-related CO2 emissions down 1.7% in 2016; carbon intensity of economy down 3.1%; transportation emissions up

Green Car Congress

US energy-related CO 2 emissions decreased by 89 million metric tons (MMmt), from 5,259 MMmt in 2015 to 5,170 MMmt in 2016. Emissions have declined in 6 out of the past 10 years, and energy‐related CO 2 emissions in 2016 were 823 MMmt (14%) below 2005 levels, according to the EIA. Transportation increase led by gasoline consumption.

2016 150