This site uses cookies to improve your experience. To help us insure we adhere to various privacy regulations, please select your country/region of residence. If you do not select a country, we will assume you are from the United States. Select your Cookie Settings or view our Privacy Policy and Terms of Use.
Cookie Settings
Cookies and similar technologies are used on this website for proper function of the website, for tracking performance analytics and for marketing purposes. We and some of our third-party providers may use cookie data for various purposes. Please review the cookie settings below and choose your preference.
Used for the proper function of the website
Used for monitoring website traffic and interactions
Cookie Settings
Cookies and similar technologies are used on this website for proper function of the website, for tracking performance analytics and for marketing purposes. We and some of our third-party providers may use cookie data for various purposes. Please review the cookie settings below and choose your preference.
Strictly Necessary: Used for the proper function of the website
Performance/Analytics: Used for monitoring website traffic and interactions
US electric power sector CO 2 emissions have declined 28% since 2005 because of slower electricity demand growth and changes in the mix of fuels used to generate electricity, according to the US Energy Information Administration (EIA). Source: US EIA, US Energy-Related Carbon Dioxide Emissions , 2017.
The US Environmental Protection Agency (EPA) released its 28 th annual Inventory of US Greenhouse Gas Emissions and Sinks (GHG Inventory), which presents a national-level overview of annual greenhouse gas emissions from 1990 to 2019. CO 2 emissions decreased 2.2% Total GHG emissions in 2019 were up 1.8% from 2018 to 2019.
A new lifecycle analysis by researchers at Argonne National Laboratory has found that the carbon intensity of corn ethanol has decreased 23%—from 58 to 45 gCO 2 e/MJ—from 2005 to 2019. Carbon intensity (gCO 2 e/MJ undenatured ethanol) of corn ethanol without LUC for 2005–2019. The ethanol produced in our 15?years
A comprehensive assessment of black-carbon climate forcing accepted for publication in the Journal of Geophysical Research: Atmospheres estimates that black carbon, with a total climate forcing of +1.1?W?m m -2 , is the second-most important human emission in terms of its climate-forcing in the present-day atmosphere.
Carbonemissions associated with increased exports from China (left), as part of a more systematic view of increased national emissions (right), 2002 to 2005. By 2005, exports—particularly metals, electronics, textiles, and chemicals—accounted for a third of China’s GDP, as compared to just 12% in 1987.Chinese
CO 2 emissions from private jets in Europe increased by nearly a third (31%) between 2005 and 2019, rising faster than commercial aviation emissions, according to a new report from environmental campaign group Transport & Environment (T&E). The report, Private jets: can the super-rich supercharge zero emission aviation?
Factors contributing to the growth in energy-related CO 2 emissions in 2010. US carbon dioxide emissions from the consumption of fossil fuels were 5,638 million metric tons carbon dioxide (MMTCO 2 ) in 2010, an increase of 3.9% However, emissions are still 6% below the 2005 level. Click to enlarge.
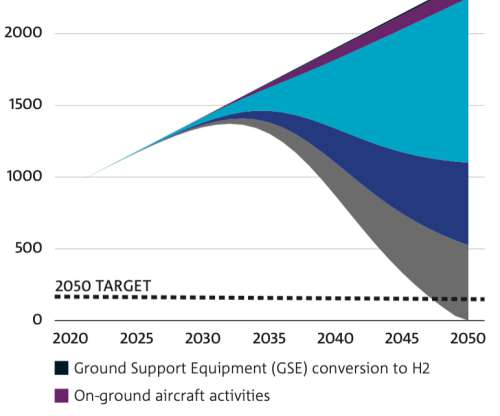
A new report from Australia’s national science agency CSIRO shows that clean hydrogen can significantly reduce aviation emissions with potential benefits seen within five years. Hydrogen used for treating crude or bio-crude oil to produce jet fuel with a lower carbon intensity is also considered as an early-stage application.
Carbonemissions from deforestation in the Brazilian Amazon have dropped 57% from 2004 to 2011, according to new data recently released by the National Institute for Space Research (INPE) in São José dos Campos, São Paulo. The data indicate a slowing trend in Brazil’s greenhouse gas emissions resulting from deforestation.
The European Union implemented a cap and trade scheme in 2005 for reducing carbonemissions; Scandinavian nations (including the non-EU state of. Norway) had independently imposed a carbon tax in the 1990s as part of their effort to reduce carbonemissions.
US President Joe Biden announced a new target for the United States to achieve a 50-52% reduction from 2005 levels in economy-wide net greenhouse gas (GHG) emissions in 2030. In 2019, US greenhouse gas emissions totaled 6,558 million metric tons of carbon dioxide equivalents (MMT CO 2 Eq.), or 5,769 MMT CO 2 Eq.
The US Environmental Protection Agency (EPA) has submitted its final Report to Congress on Black Carbon , in response to an October 2009 request from Congress to advance efforts to understand the role of black carbon (BC) in climate change. —Report to Congress on Black Carbon. emissions in 2005. Source: EPA.
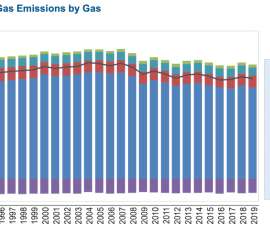
US greenhouse gas emissions by gas. The US Environmental Protection Agency (EPA) released its 19 th annual report of overall US greenhouse gas (GHG) emissions, showing a 3.4% Total emissions of the six main greenhouse gases in 2012 were equivalent to 6,526 million metric tons of carbon dioxide. Source: EPA. Source: EPA.
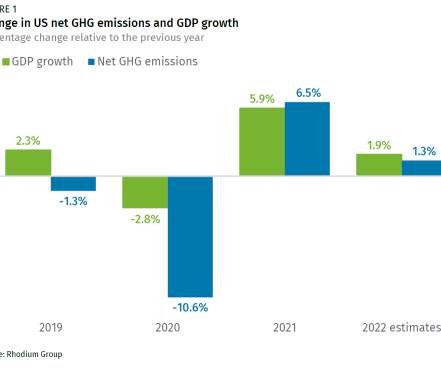
Based on preliminary economic activity and energy data, Rhodium Group estimates that greenhouse gas (GHG) emissions in the US slightly increased in 2022, rising 1.3% While this is the second year in a row that emissions have increased, it nonetheless marks a change from 2021, when emissions rebounded faster than the economic growth rate.
ANA Group, Japan’s largest airline group, aims to reduce its carbonemissions by 20% by 2020 compared with 2005 levels. ANA says it was the first airline in the global aviation industry to set itself a target for reducing total CO 2 emissions. million tons over the 2012-2020 period compared with 5 million tons in 2005.
Health and other non-climate damages by life-cycle component for different combinations of fuels and light-duty automobiles in 2005 (top) and 2030 (bottom). GHG emissions (grams CO 2 -eq)/VMT by life-cycle component for different combinations of fuels and light-duty automobiles in 2005 (top) and 2030 (bottom). Click to enlarge.
The aviation sector is united in calling on world leaders to retain a global sectoral approach to reducing aviation emissions under the leadership of the International Civil Aviation Organization (ICAO), working in cooperation with the sector through IATA. Aviation emissions should be accounted for at a global level.
Ozone, the main component of smog, is a plant-damaging pollutant formed by emissions from vehicles, cooking stoves and other sources. New research shows that ozone pollution damaged millions of tons of wheat, rice, soybean and cotton crops in India in 2005. Smog in India. Credit: Mark Danielson/Flickr.
Global sulfur dioxide emissions by region. The analysis by researchers in the US and Europe estimates anthropogenic global and regional sulfur dioxide emissions spanning the period 1850–2005 using a bottom-up mass balance method, calibrated to country-level inventory data. Emissions were distributed on a 0.5°
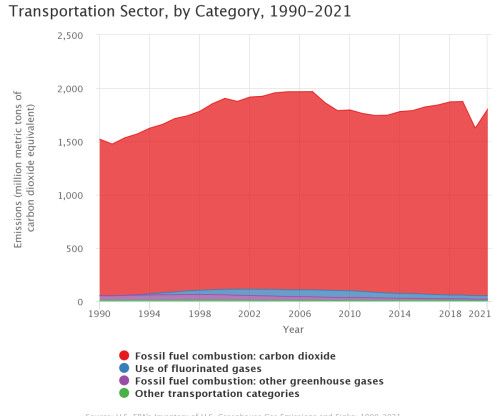
The US Environmental Protection Agency (EPA) released its 30 th annual Inventory of US Greenhouse Gas Emissions and Sinks (GHG Inventory), which presents a national-level overview of annual greenhouse gas emissions from 1990 to 2021. In 2021, US greenhouse gas emissions totaled 6,340.2 GHG emissions by economic sector.
People are choosing hybrids over similarly priced small- and medium-sized conventional cars, which are not far behind hybrids for fuel efficiency and emissions. The reductions in carbonemissions are therefore not great. If the intention of rebate programs is to replace gas guzzlers with hybrids, they are failing.
announced it would seek to reduce carbonemissions intensity from its FedEx Express aircraft and improve the fuel efficiency of its FedEx Express vehicle fleet by 20% by 2020, as compared with its 2005 performance. In 2008, FedEx Corp. and improved vehicle fuel efficiency by 16.6% at the end of its fiscal year 2011.
Including biofuels under a cap-and-trade scheme could create a more complete carbon management framework for the transportation fuels sector, according to a new peer-reviewed discussion paper by Dr. John DeCicco. In particular, it fails to cover many GHG emissions during the production of biofuels and their feedstocks.
Anthropogenic global greenhouse gas emissions increased by 15% between 2000 and 2005, a sharp increase in the expected rate of growth, according to a new report from the European Commission’s Joint Research Centre (JRC). It also provides data on greenhouse-gas emissions for the 20 years preceding the 1990 Kyoto protocol.
Emissions of NO x , a key component of smog, at the Port of Los Angeles are down 60% compared to 2005emissions levels. The newly released 2017 Inventory of Air Emissions shows the Port set new record lows for emissions reductions while its container volume reached an all-time high of 9.34
Since 2005, when major greenhouse-gas emitters among the Kyoto signatories were issued caps on their emissions and permitted to buy credits to meet those caps, there has been more than $300 billion worth of carbon transactions. The approval process for carbon offsets has two goals. Donovan, CEO of Renergie, Inc.
billion) in Grangemouth, its integrated refinery and petrochemicals complex in Scotland, in the next phase of reducing greenhouse gas emissions to net zero by 2045. INEOS acquired Grangemouth in 2005, and has so far delivered a 37% reduction in net CO 2 emissions. INEOS will invest an additional £1 billion (US$1.4 Grangemouth.
reach an agreement at ICAO for a global framework to reduce emissions from aircraft operations using technology development, efficient operations and infrastructure, and the use of international market-based measures to address any remaining emissions gap.
The US Energy Information Administration (EIA) reported that after an increase in 2010 of 3.3%, energy-related carbon dioxide emissions in the US in 2011 decreased by 2.4% (136 million metric tons), while GDP grew by 1.8%. This indicates that the carbon intensity of the economy declined by about 4.2%. per gallon.
However, total transportation energy demand in California could be reduced 30% relative to 2005 levels in 2050 through improving overall vehicle efficiency (which includes the use of advanced electric-drivetrains such as plug-in electric vehicles (PEVs) and hydrogen fuel cell vehicles (FCVs). Click to enlarge.
Webster (2011) Role of Fuel Carbon Intensity in Achieving 2050 Greenhouse Gas Reduction Goals within the Light-Duty Vehicle Sector. However, the combination of stringent goals and cost uncertainties suggests adoption of a broad portfolio of reduction options to increase the probability of meeting each goal cost effectively. Resources.
According to a new study by researchers from France, emissions of gases and particles from the combustion of fossil fuels and biofuels in Africa are expected to increase significantly in the near future due to the rapid growth of African cities and megacities. African combustion emissions already contribute significantly to global emissions.
The Qantas Group announced it will reach net zero carbonemissions by 2050 in a major expansion of the airline’s commitment to a more sustainable aviation industry. Qantas is the only airline group to commit to cap its net emissions at 2020 levels, and the second to commit to net zero emissions by 2050.
A consortium brought together by low carbon experts at the University of East Anglia (UEA) in the UK launched the first bus in the UK to run on biomethane gas. The dual-fuel diesel-biomethane powered bus is expected to reduce pollutant emissions and greenhouse gas emissions by around a half. Biomethane bus. Click to enlarge.
CO 2 emissions from transportation sector by scenario in the study. The dashed blue line is 2005emissions; the scale on the right shows the percent of 2005 level. Economy-wide CO 2 prices of $30-60/t CO 2 are too weak on their own to motivate significant reductions in CO 2 emissions from transportation.
Dominion Energy announced a significant expansion of the company's greenhouse gas emissions-reduction goals, establishing a new commitment to achieve net zero emissions by 2050. The goal covers carbon dioxide and methane emissions, the dominant greenhouse gases, from both electricity generation and gas infrastructure operations.
Using an alternative approach to determine the amount of black carbon (BC) emissions from civil aviation, researchers from the University of Cambridge, MIT, and Forschungszentrum Jülich have estimated that in 2005, total BC emissions from this sector were 16.9 near the ground).
Direct land use, life cycle GHG emissions (excluding indirect land use change), and life cycle fossil fuel requirements to generate the transportation services provided by 17.8 × 10 12 MJ NCV of gasoline, the amount used in transportation in the US in 2009. The PV system life cycle is based on 2005 technology and production data.
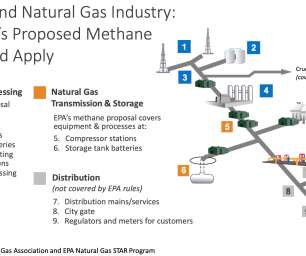
The US Environmental Protection Agency (EPA) is proposing comprehensive new regulations to reduce methane emissions from the oil and natural gas industry—including, for the first time, reductions from existing sources nationwide. Methane is a potent greenhouse gas that traps about 30 times as much heat as carbon dioxide over 100 years.
The emissions gap. Cutting emissions by 2020 to a level that could keep a global 21 st century temperature rise below 2 °C is technologically and economically feasible, according to a new study released by the UN Environment Programme (UNEP). Together they account for around 5% of CO 2 emissions and could account for up to 2.5
made progress in reducing CO 2 emissions and improving sustainability in its global corporate activities in fiscal year 2014 while simultaneously increasing vehicle production and plant energy efficiency. Nissan is utilizing a number of proven forms of sustainable energy generation to help minimize its corporate carbon footprint.
billion barrels of foreign oil and reduced US transportation-related carbonemissions by 589.33 To develop its estimates, BIO utilized the GREET1.2013 model to compare carbonemissions from the mixture of US transportation fuels (both petroleum and biofuel) under two scenarios. million metric tons. President George W.
million in Carbon Recycling International (CRI). CRI, founded in 2006 in Reykjavik, Iceland, is developing technology to produce renewable methanol from clean energy and recycled CO 2 emissions. Zhejiang Geely Holding Group (Geely Group) will invest a total of US$45.5 Earlier post.). Earlier post.)
US energy-related CO 2 emissions decreased by 89 million metric tons (MMmt), from 5,259 MMmt in 2015 to 5,170 MMmt in 2016. over that period, other factors contributing to energy-related CO 2 emissions more than offset the growth in GDP, leading to a 1.7% Natural gas CO 2 emissions have increased every year since 2009.
We organize all of the trending information in your field so you don't have to. Join 5,000+ users and stay up to date on the latest articles your peers are reading.
You know about us, now we want to get to know you!
Let's personalize your content
Let's get even more personalized
We recognize your account from another site in our network, please click 'Send Email' below to continue with verifying your account and setting a password.


Let's personalize your content