Remove 2001 Remove Carbon Remove Pollution
article thumbnail

California greenhouse gas inventory shows state is tracking to achieve 2020 AB 32 target

Green Car Congress

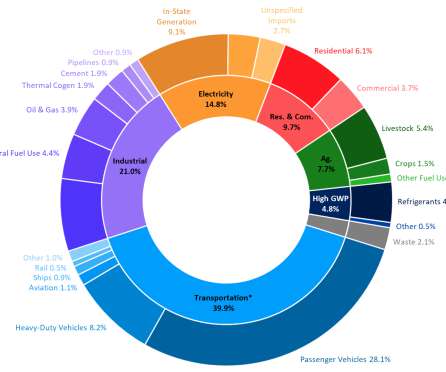
Overall trends in the inventory also demonstrate that the carbon intensity of California’s economy, the amount of carbon pollution per million dollars of GDP, is declining. Carbon intensity has dropped 23% from the peak in 2001, and declined an average of 1.9% tons per person in 2001 to 12.0

article thumbnail

Satellite study suggests California clean air regulations working to reduce PM2.5 emissions in state

Green Car Congress

pollution in the state. is especially burdensome in California and accounts for the greatest percentage of health impacts attributable to air pollution. km-resolution MISR aerosol properties over Southern California for years 2001–2003, 2007–2009 and 2013–2015. to predict PM 2.5 Most monitors do not track individual PM 2.5

Insiders

Sign Up for our Newsletter

This site is protected by reCAPTCHA and the Google Privacy Policy and Terms of Service apply.

Trending Sources

article thumbnail

Peking University team develops method for modeling historical global black carbon emissions from motor vehicles with reduced uncertainty

Green Car Congress

Researchers at Peking University have developed a new methodology to model black carbon (BC) emissions from diesel and gasoline motor vehicles. Black carbon is a key short-lived climate change forcer ( earlier post ) and motor vehicles are important sources of BC in the environment. Credit: ACS, Wang et al. Click to enlarge.

article thumbnail

California ARB: GHG emissions fell below 1990 levels for first time in 2016; down 13% from 2004 peak; transportation emissions up 2%

Green Car Congress

The state’s latest Greenhouse Gas Emissions Inventory shows that California emitted 429 million metric tons of climate pollutants in 2016—a drop of 12 million metric tons, or three percent, from 2015. They fell 23% from a peak of 14 metric tons per person (roughly equal to driving 34,000 miles) in 2001 to 10.8

article thumbnail

Latest GHG Inventory shows California remains below 2020 emissions target; much steeper rate of GHG reductions required

Green Car Congress

California’s latest greenhouse gas data shows that while the state continues to stay below its 2020 target for emissions, there is much more work to do to achieve carbon neutrality by 2045. Per capita GHG emissions in California have dropped from a 2001 peak of 14.0 Source: California Air Resources Board (ARB). tons per person to 10.7

article thumbnail

EPA proposes approval of new ozone plans for the two of the worst Air Quality Zones in US: California’s San Joaquin Valley and South Coast

Green Car Congress

The worst sites in California have demonstrated a 52% improvement in ozone from 1976 to 2010, a 29% improvement in fine particulate matter (PM 2.5 ) from 2001 to 2010, an 84% improvement in carbon monoxide from 1970 to 2009, and a 92% improvement in sulfur dioxide from 1970 to 2009.

article thumbnail

Canada publishes proposed regulations for criteria pollutants from locomotives

Green Car Congress

This marks Canada’s first regulation of air pollutant emissions from locomotives. CACs include NO x ; particulate matter (PM); hydrocarbons (HC), carbon monoxide (CO); and sulfur oxides (SO x ). 1973–2001. 1973–1992. 1993–2004. 2005–2011. 2012–2014. 2015 or later. Switch locomotive emission standards. Year of manufacture.