Remove 2000 Remove Ozone Remove Pollution
article thumbnail

TOAR shows present-day global ozone distribution and trends relevant to health; public database

Green Car Congress

Ozone levels across much of North America and Europe dropped significantly between 2000 and 2014. People living in parts of southern Europe, South Korea and southern Japan and China also experienced more than 15 days a year of ozone levels above 70 ppb. Source: University of Leicester. Click to enlarge.

Ozone 255
article thumbnail

EPA proposes approval of new ozone plans for the two of the worst Air Quality Zones in US: California’s San Joaquin Valley and South Coast

Green Car Congress

US EPA Region 9 8-hour ozone trends, 1979-2000. These State Implementation Plans (SIPs) are the roadmaps to meeting the 1997 8-hour ozone National Ambient Air Quality Standards (NAAQS) of 0.08 In 1997, EPA first established the 8-hour ozone standard, which replaced the older 1-hour ozone standard (0.12 Source: EPA.

Ozone 236
article thumbnail

Emissions of Air Pollutants down in EU-27

Green Car Congress

The European Community’s air pollutant emission inventory report released by the European Environment Agency finds that in 2007, sulphur oxides (SO x ) emissions were down by 72 % from 1990 levels. EU-27 emissions of all four pollutants were lower in 2007 than in 2006.

Pollution 236
article thumbnail

Cutting Non-CO2 Pollutants Can Delay Abrupt Climate Change; The Fast Action Climate Agenda

Green Car Congress

HFCs are powerful greenhouse gases originally developed as substitutes for ozone-depleting chemicals. A binding legal agreement exists that can cut HFCs now—the Montreal Protocol ozone treaty—and many alternatives to HFCs have already been developed and are waiting for the right regulatory incentive from the Montreal Protocol to be deployed.

article thumbnail

US EPA Reports National Trends Show Improvements in Air Quality

Green Car Congress

Since 1990, nationwide air quality has improved significantly for the six common air pollutants: ground-level ozone; particle pollution; lead; nitrogen dioxide; carbon monoxide; and sulfur dioxide, according to the US Environmental Protection Agency (EPA) report “Our Nation’s Air - Status and Trends through 2008”. annual PM 2.5

EPA 186
article thumbnail

Study Finds On-Road Transportation Sector the Greatest Net Contributor to Atmospheric Warming Now and in Mid-Term; Power Sector Takes the Lead by 2050

Green Car Congress

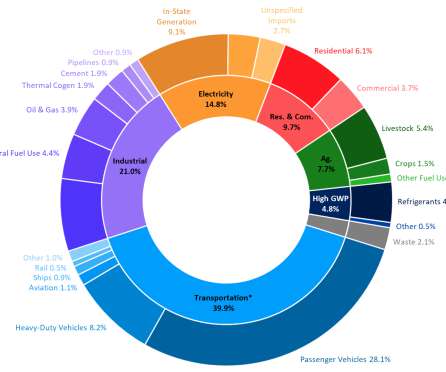
Radiative forcing due to perpetual constant year 2000 emissions grouped by sector for 2020 (left) and 2100 (right) showing the contribution from each species. Cars, buses, and trucks release pollutants and greenhouse gases that promote warming, while emitting few aerosols that counteract it. From Unger et al., Click to enlarge.
article thumbnail

PSI team develops web tool for consumers to compare environmental impact of passenger cars in detail

Green Car Congress

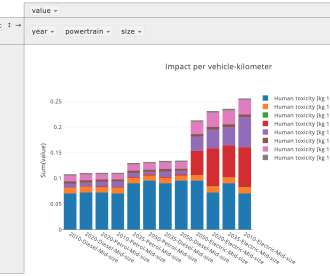
Deterioration of the ozone layer [kg CFC-11-eq.]. The user also selects the country where the vehicles are to be used—because this differentiates the electricity mix for electric cars—as well as the year, between 2000 and 2050, when the cars will be registered. Depletion of fossil energy resources [kg oil-eq.].

Mariner 435