This site uses cookies to improve your experience. To help us insure we adhere to various privacy regulations, please select your country/region of residence. If you do not select a country, we will assume you are from the United States. Select your Cookie Settings or view our Privacy Policy and Terms of Use.
Cookie Settings
Cookies and similar technologies are used on this website for proper function of the website, for tracking performance analytics and for marketing purposes. We and some of our third-party providers may use cookie data for various purposes. Please review the cookie settings below and choose your preference.
Used for the proper function of the website
Used for monitoring website traffic and interactions
Cookie Settings
Cookies and similar technologies are used on this website for proper function of the website, for tracking performance analytics and for marketing purposes. We and some of our third-party providers may use cookie data for various purposes. Please review the cookie settings below and choose your preference.
Strictly Necessary: Used for the proper function of the website
Performance/Analytics: Used for monitoring website traffic and interactions
Schematic overview of the primary black-carbon emission sources and the processes that control. the distribution of black carbon in the atmosphere and determine its role in the climate system. Accounting for all of the ways black carbon can affect climate, it is believed to have a warming effect of about 1.1
A new report from the MIT Joint Program on the Science and Policy of Global Change shows the importance of all major nations taking part in global efforts to reduce emissions—and in particular, finds China’s role to be crucial. From 2000 to 2010, China’s energy use grew 130%, up from a growth of 50% the previous decade.
Significant climate anomalies 2008/2009. Source: ClimateChange Compendium. Ocean acidification caused by the absorption of carbon dioxide in seawater is already increasing along the California coast decades earlier than existing models predict. per year from 2000-2007. Click to enlarge. Earlier post.).
Decadal warming rates arising from (i) greenhouse gases and aerosols alone (black); (ii) that obtained including the stratospheric water decline after 2000 (red); and (iii) including both the stratospheric water vapor decline after 2000 and the increase in the 1980s and 1990s (cyan). Credit: Solomon et al., Click to enlarge.
Global accounting firm PricewaterhouseCoopers has analyzed carbon emissions from 2000 to 2008 and concluded that the world’s “carbon emissions budget”, or ability to emit carbon dioxide while still maintaining a “fair chance” of limiting average global temperatures to no more than 2 ºC (3.6
Global carbon dioxide emissions from burning fossil fuels have increased by 49% in the last two decades, according to the latest figures from the Global Carbon Project. Total emissions—including fossil fuel combustion, cement production, deforestation and other land use emissions—reached 10 billion tonnes of carbon (36.7
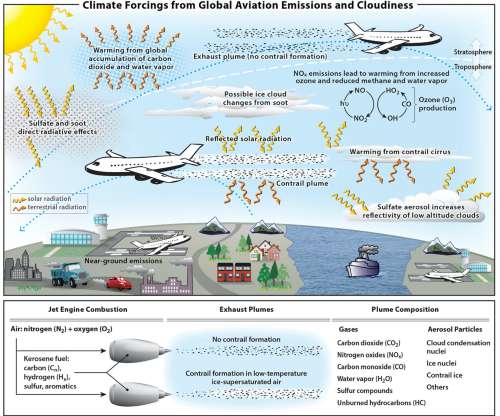
It makes an important contribution to the scientific understanding we have of the role of aviation for climatechange—an understanding decision-makers and politicians may need on the way to achieving the goals of the Paris Agreement. This new study is based on a thorough review of a decade of research on aviation emissions.
Noting the references in scientific and policy literature to the need for fast-action mitigation to help avoid DAI and abrupt climatechanges, the authors define “fast-action” to include regulatory measures that can begin within 2–3 years, be substantially implemented in 5–10 years, and produce a climate response within decades.
Radiative forcing due to perpetual constant year 2000 emissions grouped by sector for 2020 (left) and 2100 (right) showing the contribution from each species. The team also considered how emissions from each part of the economy can impact clouds, which have an indirect effect on climate. From Unger et al., Click to enlarge.
Despite the economic effects of the global financial crisis (GFC), carbon dioxide emissions from human activities rose 2% in 2008 to an all-time high of 1.3 tonnes of carbon per capita per year, according to a new paper published by an international team of 31 scientists in Nature Geoscience. over the previous seven years.
Black carbon emissions and BC emissions intensity per year. A study led by a team from Peking University has estimated that global black carbon (BC) emissions increased from 5.3 Black carbon has two deleterious effects on the environment. 2 , and that BC is an important warming species in addition to carbon dioxide and methane.
ExxonMobil and Global Thermostat signed a joint development agreement to advance technology that can capture and concentrate carbon dioxide emissions from industrial sources, including power plants, and the atmosphere. ExxonMobil and Global Thermostat are also exploring opportunities to identify economic uses for captured carbon dioxide.
C (1.26 °F) since 1960 and other observed changes in rainfall, sea level rise, ocean acidification and atmospheric CO 2 concentration show that “ climatechange is real ”, according to a joint CSIRO/Bureau of Meteorology (BOM) statement and snapshot of the state of the country’s climate. C, 0.72 °F). Ocean acidification.
In 2009, energy-related carbon dioxide emissions in the United States saw their largest absolute and percentage annual decline (405 million metric tons or 7.0%) since the start of US Energy Information Administration’s (EIA) comprehensive record of annual energy data that begins in 1949. Source: EIA. Click to enlarge. between 2008 and 2009.
Australia Prime Minister Julia Gillard unveiled Australia’s carbon pricing plan—a core element in a new clean energy plan—in a short address to the nation. The Government intends to introduce legislation to underpin the carbon pricing mechanism into Parliament in the second half of 2011. Click to enlarge.
Without decisive action, climatechange this century is likely to accelerate at a much faster pace and cause more environmental damage than predicted, according to Professor Chris Field of Stanford University, and a leading member of the UN Intergovernmental Panel on ClimateChange. Chris Field. Chris Field.
Decomposition of the decadal change in total global CO 2 emissions from fossil fuel combustion by four driving factors; population, income (GDP) per capita, energy intensity of GDP and carbon intensity of energy. giga tonne carbon dioxide equivalent (GtCO 2 eq) (2.2%) per year from 2000 to 2010 compared to 0.4
The analysis indicates that natural carbon sinks are maintaining overall resilience despite recent signs that the carbon uptakes of specific sinks are in decline. Approximately 40-45% of carbon emissions emitted every year remain in the atmosphere, with the balance absorbed as part of the Earth’s carbon cycle. per decade.
Evolution of the carbon dioxide emissions calculated by the model (left) and the temporal development of the global mean annual temperature (right). In order to achieve the long-term stabilization of the atmospheric carbon dioxide concentration, fossil carbon dioxide emissions must be reduced to around zero by the end of the century.
The initiative is sponsored by the Carbon Disclosure Project (CDP), which established the disclosure and reporting framework used by 2,500 of the world’s largest companies to report carbon emissions. Ford has reported to the CDP on its successful efforts to reduce its carbon footprint since 2003. billion gallons.
The US Environmental Protection Agency (EPA) has submitted its final Report to Congress on Black Carbon , in response to an October 2009 request from Congress to advance efforts to understand the role of black carbon (BC) in climatechange. —Report to Congress on Black Carbon. Click to enlarge.
PwC analysis finds a need for global carbon intensity to drop an average of 5.1% The analysis is based on a carbon budget that would stabilize atmospheric carbon dioxide concentrations at 450 ppm and give a 50% probability of limiting warming to 2 °C. —Leo Johnson, Partner, Sustainability and ClimateChange, PwC.
Temperature change per transport work by mode for various years after the emissions: per passenger kilometer for passenger travel (left) and per ton-kilometer for freight transport (right). Global average values for the year 2000. Car travel emits more carbon dioxide than air travel per passenger mile. Bars represent 1 SD.
A new study by a team at the Dalton Research Institute in the UK projects that carbon dioxide and other gases from air traffic will become a significant source of global warming as they double or triple by 2050. Global air traffic currently contributes to between 2 and 3% of carbon dioxide emissions. Credit: ACS, Owen et al.
In particular, the study led by Drew Shindell found that methane emissions have a larger warming impact due to those interactions than accounted for in current carbon-trading schemes or in the Kyoto Protocol. It’s a seemingly minor change, but it makes a difference to the climate. Shindell et al. —Drew Shindell.
Anthropogenic global greenhouse gas emissions increased by 15% between 2000 and 2005, a sharp increase in the expected rate of growth, according to a new report from the European Commission’s Joint Research Centre (JRC). Carbon dioxide showed the greatest growth, but levels of gases such as methane and nitrous oxide have also increased.
When peat swamps are drained for agriculture, the peat begins to decompose, and is an enormous source of carbon emissions. Based on visual interpretation of high-resolution (30 m) satellite images, a new study in the journal Global Change Biology: Bioenergy determined that industrial plantations covered over 3.1 —Miettinen et al.
The US Energy Information Administration (EIA) has released a new report, State-Level Energy-Related Carbon Dioxide Emissions, 2000-2010. The report shows a significant variation of energy-related carbon dioxide emissions across states on both an absolute and a per capita basis. Source: EIA. Click to enlarge. million tonnes).
Energy-related carbon-dioxide (CO2) emissions in 2010 were the highest in history, according to the latest estimates by the International Energy Agency (IEA). Global leaders agreed a target of limiting temperature increase to 2 °C at the UN climatechange talks in Cancun in 2010. Earlier post.).
Global sulfur dioxide (SO 2 ) emissions peaked in the early 1970s and decreased until 2000, with an increase in recent years due to increased emissions in China, international shipping, and developing countries in general, according to a new analysis appearing in the open access journal Atmospheric Chemistry and Physics. Credit: Smith et al.
Daimler AG has received top marks for disclosure of its climate protection measures aimed at combating climatechange, receiving the maximum 100 points in the Carbon Disclosure Project’s (CDP’s) “Climate Disclosure Leadership Index” and an “A” rating in the “Climate Performance Leadership Index”.
The SMP model calculates 2000?2050 The Ford team updated the SMP model with historical data for 2000, 2005, and 2010, and extended the model to calculate the total CO 2 emissions (tonnes) and the TTW (tank-to-wheel) emission rate (g CO 2 /km) for the new vehicle fleet. They converted from an absolute amount to scale relative to 2000.
Gigatonnes (Gt) of carbon dioxide (Gt CO 2 eq)—comparable to total current annual emissions from transport, estimated at around 6-7 Gt annually. W m -2 relative to 2000. Climate and the Ozone Layer. By 2050, the buildup of HFCs is projected to increase radiative forcing by up to 0.4
The authors analyzed measurements from several independent sources—satellites and several types of ground instruments—and found a definitive increase in stratospheric aerosol since 2000. The increase in aerosols since 2000 implies a cooling effect of about 0.1 watts per square meter—enough to offset some of the 0.28
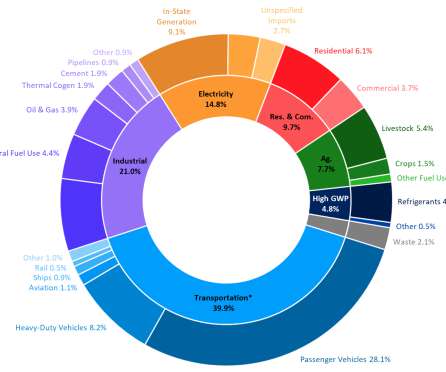
California’s latest greenhouse gas data shows that while the state continues to stay below its 2020 target for emissions, there is much more work to do to achieve carbon neutrality by 2045. All these climate programs have considerably more stringent emissions reduction targets starting in 2021. tons per person to 10.7
Each estimate has a range of uncertainty of at least 2 GtCO 2 e, reflecting different assumptions for emissions drivers such as business-as-usual (BAU) scenarios, national actions, land use change, base year emissions, future baseline emissions, and future energy intensities for different countries. Tags: ClimateChange.
Initial work between ExxonMobil and the national laboratories will explore ways to bring biofuels and carbon capture and storage to commercial scale across the power generation, transportation, and manufacturing sectors. The company has spent more than $9 billion since 2000 developing and deploying lower-emissions energy solutions.
Moller - Maersk is accelerating its efforts to decarbonize marine operations with the launch of the first carbon-neutral feeder vessel in 2023—seven years ahead of the initial 2030 ambition. Our ambition to have a carbon-neutral fleet by 2050 was a moonshot when we announced in 2018. —Søren Skou, CEO, A.P. Moller - Maersk.
The results from the Maritime CCS (carbon capture and storage) research and development project show that the concept is technically feasible and capable of reducing ship CO 2 emissions by up to 65%. Det Norske Veritas (DNV), a leading classification society, and Process Systems Enterprise Ltd.
The UK automotive industry warned that the current anti-diesel agenda combined with the ongoing slow take-up of electric vehicles could mean industry misses its next round of CO 2 targets in 2021, with negative consequences for the UK’s own climatechange goals. less CO 2 than those they replaced. decline in new diesel registrations.
A paper by a team from the University of Chicago and MIT suggests that technology-driven cost reductions in fossil fuels will lead to the continued use of fossil fuels—oil, gas, and coal—unless governments pass new taxes on carbon emissions. We need both a policy like a carbon tax and to put more R&D money into renewables.
Two possible futures: One in which no climate policies are implemented (red), and one with strong action to mitigate emissions (blue). The researchers, involving scientists from Germany, the United Kingdom and Switzerland, concluded that the limit is 1,000 billion tonnes of carbon dioxide between the years 2000 and 2050.
Effects of changes in the average lifespan of ordinary passenger cars newly registered between 1990-2000 on total induced CO 2 emissions in 2000. This finding implies that the product lifetime extension scenario would clearly contribute to a reduction in carbon emissions, the authors said. Credit: ACS, Kagawa et al.
Moving goods by road consumes about 50% of all diesel produced; 80% of the global net increase in diesel use since 2000 comes from road freight. However, achieving climatechange targets will also require the widespread adoption of solutions that are not yet fully developed, whether in logistics or technology.
We organize all of the trending information in your field so you don't have to. Join 5,000+ users and stay up to date on the latest articles your peers are reading.
You know about us, now we want to get to know you!
Let's personalize your content
Let's get even more personalized
We recognize your account from another site in our network, please click 'Send Email' below to continue with verifying your account and setting a password.


Let's personalize your content