This site uses cookies to improve your experience. To help us insure we adhere to various privacy regulations, please select your country/region of residence. If you do not select a country, we will assume you are from the United States. Select your Cookie Settings or view our Privacy Policy and Terms of Use.
Cookie Settings
Cookies and similar technologies are used on this website for proper function of the website, for tracking performance analytics and for marketing purposes. We and some of our third-party providers may use cookie data for various purposes. Please review the cookie settings below and choose your preference.
Used for the proper function of the website
Used for monitoring website traffic and interactions
Cookie Settings
Cookies and similar technologies are used on this website for proper function of the website, for tracking performance analytics and for marketing purposes. We and some of our third-party providers may use cookie data for various purposes. Please review the cookie settings below and choose your preference.
Strictly Necessary: Used for the proper function of the website
Performance/Analytics: Used for monitoring website traffic and interactions
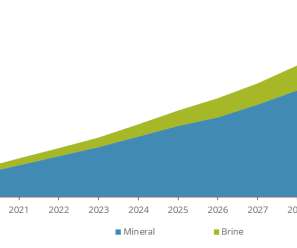
With demand for lithium set to increase over the next decade, Roskill has calculated , using its in-house analysis, that CO 2 emissions from lithium production are set to triple by 2025 versus current levels and to grow by a factor of six by 2030, with the vast majority of this coming from mineral concentrate production, shipping and refining.
US electric power sector CO 2 emissions have declined 28% since 2005 because of slower electricity demand growth and changes in the mix of fuels used to generate electricity, according to the US Energy Information Administration (EIA). Source: US EIA, US Energy-Related Carbon Dioxide Emissions , 2017.
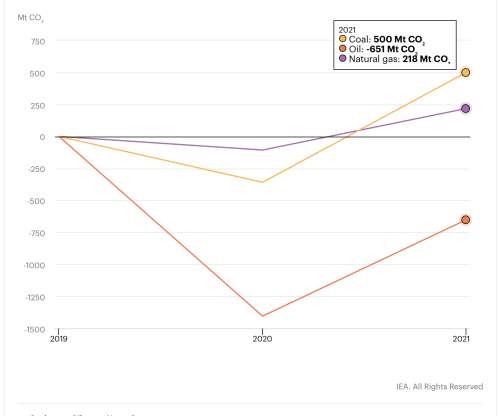
Global energy-related carbon dioxide emissions rose by 6% in 2021 to 36.3 billion tonnes, their highest ever level, as the world economy rebounded strongly from the COVID-19 crisis and relied heavily on coal to power that growth, according to new IEA analysis. In 2021 alone, China’s CO 2 emissions rose above 11.9 billion tonnes.
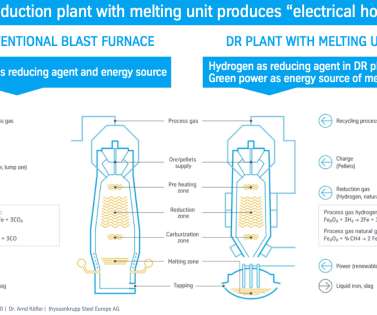
million metric tons, will avoid the emission of 3.5 As part of its tkH2Steel transformation project, coal-based blast furnaces will be replaced by hydrogen-powered direct reduction plants. Thus, the Duisburg steelworks is continuing to boil steel as in the past—but with hydrogen and green power instead of coal.
Life-cycle GHG emissions from fossil and alternative sources of electricity. Lead author Kharecha and colleagues note that current climate science indicates that atmospheric CO 2 concentrations, already at 387 ppm in 2009 and rising, need to be reduced to no more than 350 ppm. Credit: ACS, Kharecha et al. Click to enlarge.
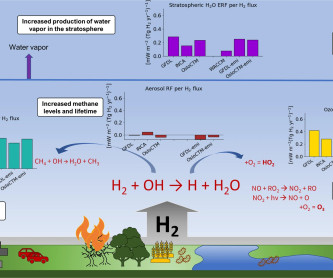
A study led by Norwegian climate center CICERO has found that the global warming effect of leaked hydrogen is almost 12 times stronger than that of CO 2. Unlike exhaust from burning coal and gas that contains CO 2 , burning hydrogen emits only water vapor and oxygen. The climate effects of hydrogen have been an under-researched topic.
Fuel-cycle SO 2 emissions of EVs compared to those of gasoline ICEVs and HEVs in China, current (left) and future (right). The study examined the fuel-cycle CO 2 , SO 2 , and NO x emissions of EVs in China in both current (2008) and future (2030) periods and compared them with those of conventional gasoline vehicles and gasoline hybrids.
Energy-related carbon-dioxide (CO2) emissions in 2010 were the highest in history, according to the latest estimates by the International Energy Agency (IEA). After a dip in 2009 caused by the global financial crisis, emissions are estimated to have climbed to a record 30.6 tonnes for China, and 1.5 tonnes in India.
CO 2 per capita emissions from fossil fuel use and cement production from the top 5 emitting regions. Global emissions of CO 2 increased by 3% last year, according to the annual report “Trends in global CO 2 emissions”, released by the EC Joint Research Centre (JRC) and the Netherlands Environmental Assessment Agency (PBL).
Schematic overview of the primary black-carbon emission sources and the processes that control. the distribution of black carbon in the atmosphere and determine its role in the climate system. Accounting for all of the ways black carbon can affect climate, it is believed to have a warming effect of about 1.1 Source: Bond et al.
A team at George Washington University has demonstrated a new solar process that can produce lime (CaO) for cement without any emission of carbon dioxide, and at lower projected cost than the existing cement industry process. The majority (about 60%) of those CO 2 emissions result from the production of lime. —Licht et al.
Aviation climate change impacts pathway. A new study by researchers at MIT has found that factoring the non-CO 2 combustion emissions and effects into the lifecycle of a Synthetic Paraffinic Kerosene (SPK) aviation fuel can lead to a decrease in the relative environmental merit of the SPK fuel compared to conventional jet fuel.
The US Environmental Protection Agency (EPA) has proposed Clean Air Act standards to reduce CO 2 emissions from fossil-fuel fired power plants (electric utility generating units, EGUs). The proposed rulemaking establishes separate standards for natural gas and coal plants.
US CO 2 emissions growth. In its current version of the Short Term Energy Outlook ( STEO ), the US Energy Information Administration projects a 5% decline in fossil-fuel-based CO 2 emissions in 2009. decrease in CO 2 emissions from fossil fuels in 2008. decline in coal-based CO 2 emissions for 2009. Natural Gas.
Despite the economic effects of the global financial crisis (GFC), carbon dioxide emissions from human activities rose 2% in 2008 to an all-time high of 1.3 Other main findings of the study include: CO 2 emissions from the burning of fossil fuels have increased at an average annual rate of 3.4% over the previous seven years.
Global CO 2 emissions from fossil fuel use and cement production reached a new all-time high in 2013, according to the annual report “Trends in global CO2emissions”, released by PBL Netherlands Environmental Assessment Agency and the European Joint Research Centre (JRC). The much lower emissions increase in China of 4.2%
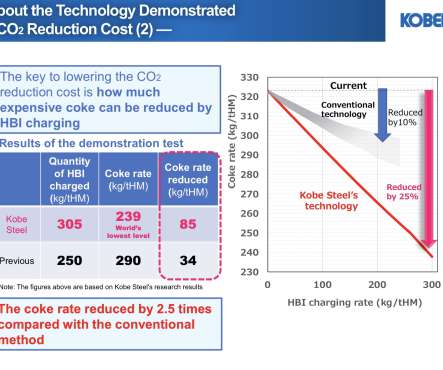
(KOBELCO) has successfully demonstrated technology that can reduce CO 2 emissions from blast furnace operations by approximately 20% by combining the Midrex’ HBI technologies and the blast furnace operations of Kobe Steel. Coke is carbon fuel made from coal. RAR is thus the quantity of carbon fuel used in blast furnace ironmaking.
US President Barack Obama said the US will cut net greenhouse gas emissions in the US by 26-28% below 2005 levels by 2025. Together, the US and China account for more than one third of global greenhouse gas emissions. The US and China jointly announced greenhouse gas (GHG) reduction targets. per year on average between 2020 and 2025.
Energy-related CO 2 emissions buy state, 2010. The US Energy Information Administration (EIA) has released a new report, State-Level Energy-Related Carbon Dioxide Emissions, 2000-2010. The report shows a significant variation of energy-related carbon dioxide emissions across states on both an absolute and a per capita basis.
The MIT Energy Initiative has released a new report on reducing carbon dioxide emissions from existing coal plants. There is no credible pathway toward prudent greenhouse gas stabilization targets without CO 2 emissions reduction from existing coal power plants. We may not see a strong CO 2 price signal for many years.
US energy-related CO 2 emissions declined by 2.8% CO 2 emissions had increased by 2.9% Because of continuing trends in how much energy the US economy uses and how much CO 2 that energy use generates, energy-related CO 2 emissions in 2019 fell more than energy consumption, which declined by 0.9%
In its recently released Inventory of US Greenhouse Gas Emissions and Sinks: 1990 – 2011 ( earlier post ), the US Environmental Protection Agency (EPA) reported that methane (CH 4 ) emissions from the field production of natural gas have declined by 36% from 2007 to 2011 (from 83.1 CH 4 emissions represented 8.8%
emissions from fossil fuel use and cement production per region. After a decline in global CO 2 emissions in 2009 of 1% (including a. correction for the leap year 2008), global emissions have. After a decline in global CO 2 emissions in 2009 of 1% (including a. correction for the leap year 2008), global emissions have.
The solar reforming technology platform will be co-located next to industrial facilities that have waste CO 2 streams such as coal power plants, natural gas processing facilities, ethanol plants, cement production facilities and other stationary sources of CO 2. Tags: Catalysts Climate Change Emissions Fuels Solar.
Natural gas will play a leading role in reducing greenhouse-gas emissions over the next several decades, largely by replacing older, inefficient coal plants with highly efficient combined-cycle gas generation, according to a major new interim report out from MIT. The first two reports dealt with nuclear power (2003) and coal (2007).
gigatonne gap between CO 2 emissions calculated on the basis of the two publicly available official energy data sets from China: one national, the other provincial. The area chart shows the increase of CO 2 emissions calculated from the national energy statistics since 1997 broken down by different fuel type. Source: Guan et al.
Carbon dioxide emissions from S energy consumption will remain near current levels through 2050, according to projections in EIA’s Annual Energy Outlook 2019. USenergy-related carbon dioxide emissions and fossil fuel energy consumption. Energy-related CO 2 emissions generally follow energy consumption trends.
Global energy-related carbon dioxide emissions were flat for a third straight year in 2016 even as the global economy grew, according to the International Energy Agency. The data signal a continuing decoupling of emissions and economic activity. Global emissions from the energy sector stood at 32.1
Given current policies and regulations limiting fossil fuel use, worldwide energy-related CO 2 emissions rise from about 31 billion metric tons in 2010 to 36 billion metric tons in 2020 and then to 45 billion metric tons in 2040, a 46% increase over the 30-year span. Liquid fuels. trillion kilowatthours in 2010 to 5.5
A new study finds that the growth of carbon production from Chinese exports has slowed or reversed, reflecting a “new phase of globalization” between developing countries that could undermine international efforts to reduce emissions. The paper is published in Nature Communications.
Global carbon dioxide emissions show no sign of abating and may reach record levels in 2010, according to a study led by the University of Exeter (UK). The global financial crisis severely affected western economies, leading to large reductions in CO 2 emissions. For example, UK emissions were 8.6% below the record 2008 figures.
The President’s Council of Advisors on Science and Technology (PCAST) released a letter to President Obama describing six key components the advisory group believes should be central to the Administration’s strategy for addressing climate change. Both approaches are essential parts of an integrated strategy for dealing with climate change.
Indeed, much of Big Oil's reduction in greenhouse gas (GHG) emissions leans on the so-called natural gas bridge. BIT:ENI) recently unveiled what has been hailed as the most ambitious climate pledge yet by an oil supermajor. Eni has announced plans to cut down its greenhouse gas emissions by 80% over the next three decades.
Removing fossil fuel subsidies would have only a small effect on CO 2 emissions and renewable energy use, according to a new study led by the International Institute for Applied Systems Analysis (IIASA) and published in the journal Nature. That means that in some cases the removal of subsidies causes a switch to more emissions-intensive coal.
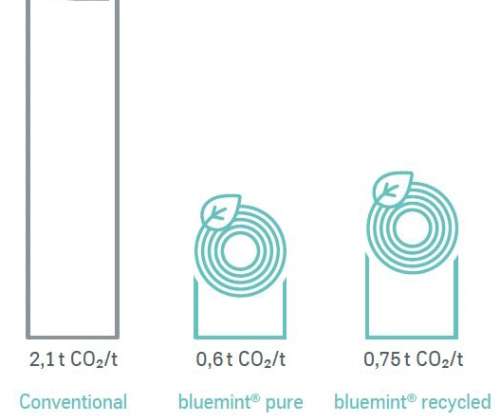
Compared with conventional steel, bluemint Steel used for sustainable wheel production offers emission savings of 70% up to the hot strip production stage. This enables less coal to be used for the reduction process, resulting in reduced emissions. In this way, the CO 2 intensity of each metric ton is reduced by 1.5 metric tons.
Researchers have measured CO 2 emissions from fossil fuel use in California and compared them to reported emissions. This is the first time fossil fuel emissions have been independently checked for such a large area. Fossil fuels lack a type of radioactive carbon, an isotope called carbon-14, which decays over time.
Global CO 2 emissions from fuel use and cement production by region. Emissions increased by 1.7% Global CO2emissions increased from 15.3 The lower increase in CO 2 emissions was mainly due to a decrease in global fossil oil consumption of about 0.6%, the first global decrease since 1992. Source: PBL.
Fuel cycle analysis (FCA)—or “well-to-wheels analysis”—is a type lifecycle analysis (LCA) that examines fuel products and their supply chains, and that has greatly influenced climate-related research priorities and public policies for transportation fuels. Logic tree for options to address CO 2 emissions from liquid fuel use.
US energy-related CO 2 emissions decreased by 89 million metric tons (MMmt), from 5,259 MMmt in 2015 to 5,170 MMmt in 2016. over that period, other factors contributing to energy-related CO 2 emissions more than offset the growth in GDP, leading to a 1.7% Natural gas CO 2 emissions have increased every year since 2009.
However, the report advises, long-term solutions to global challenges remain scarce; as one example, the report sees global CO 2 emissions rising by 20% to 37.2 China is about to become the largest oil-importing country and India becomes the largest importer of coal by the early 2020s. Gt by 2035. —WEO-2013.
Anthropogenic atmospheric CO 2 , fossil fuel emissions, world GDP, and world population for the past century. Emissions of two of the most important climate change gases increased last year, according to a preliminary analysis for NOAA’s annual greenhouse gas index, which tracks data from 60 sites around the world. Credit: NOAA.
Low embodied carbon steel, with a defined specific emissions intensity which takes into account the proportion of end of life scrap. Steel production is a major source of CO 2 emissions for the automotive industry, averaging 33% of all production-related emissions for a new Volvo car in 2021. Earlier post.).
In both the base-case and a scenario with more aggressive environmental policies, CO 2 emissions from energy use remain well above the IEA 450 scenario. However, both cases result in global CO 2 emissions well above the IEA 450 scenario—a back-cast which illustrates what is required to stabilize greenhouse gas concentrations at 450 ppm.
US and Swiss researchers have modeled two climate scenarios with very high carbon emissions—above the A1F1 scenario, currently representing the upper bound of predicted carbon emissions in the IPCC work—to investigate the resulting climate change implications. —Sanderson et al.
We organize all of the trending information in your field so you don't have to. Join 5,000+ users and stay up to date on the latest articles your peers are reading.
You know about us, now we want to get to know you!
Let's personalize your content
Let's get even more personalized
We recognize your account from another site in our network, please click 'Send Email' below to continue with verifying your account and setting a password.


Let's personalize your content