Remove Carbon Remove Climate Change Remove EPA Remove Gas-Electric
article thumbnail

EPA GHG Inventory shows US GHG down 1.7% y-o-y in 2019, down 13% from 2005

Green Car Congress

The US Environmental Protection Agency (EPA) released its 28 th annual Inventory of US Greenhouse Gas Emissions and Sinks (GHG Inventory), which presents a national-level overview of annual greenhouse gas emissions from 1990 to 2019. Source: EPA. Source; EPA. CO 2 emissions decreased 2.2% from 2018 to 2019.

2005 418
article thumbnail

EPA proposes new pollution standards for fossil fuel-fired power plants

Green Car Congress

The US Environmental Protection Agency (EPA) has proposed new CO 2 standards for coal and natural gas-fired power plants. Through 2042, EPA estimates the net climate and health benefits of the standards on new gas and existing coal-fired power plants are up to $85 billion.

EPA 225
article thumbnail

EPA annual inventory shows US GHG up 3.1% from 2017-2018

Green Car Congress

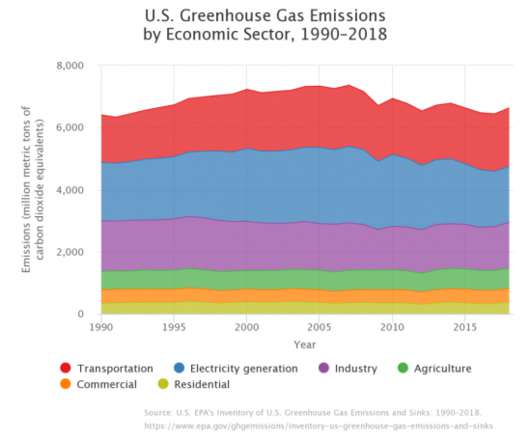
The 2020 edition of US Environmental Protection Agency’s (EPA) comprehensive annual report on nationwide greenhouse gas (GHG) emissions shows that emissions increased from 2017 to 2018 by 3.1% (after accounting for sequestration from the land sector). Source: EPA. >. Transportation sector.

2018 243
article thumbnail

EPA: US GHG fell 0.5% y-o-y in 2017; power sector down by 4.2%, transportation up 1.21%

Green Car Congress

Year-over-year, US greenhouse gas emissions were 0.5% lower in 2017 than the prior year (after accounting for sequestration from the land sector), and power sector emissions fell 4.2%, according to the 2019 edition of the US Environmental Protection Agency’s (EPA) annual report on greenhouse gas (GHG) emissions.

2017 199
article thumbnail

EPA: US greenhouse gases dropped 3.4% in 2012 from 2011; down 10% from 2005 levels

Green Car Congress

US greenhouse gas emissions by gas. Source: EPA. The US Environmental Protection Agency (EPA) released its 19 th annual report of overall US greenhouse gas (GHG) emissions, showing a 3.4% Total emissions of the six main greenhouse gases in 2012 were equivalent to 6,526 million metric tons of carbon dioxide.

2005 252
article thumbnail

EPA annual US GHG inventory shows 1.6% drop in 2011 from previous year; transportation CO2 down 1.1%

Green Car Congress

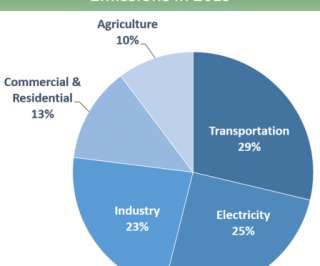
Total US greenhouse gas emissions by economic sector in 2011. The US Environmental Protection Agency (EPA) released its 18 th annual report of overall US greenhouse gas (GHG) emissions showing a 1.6% Total emissions of the six main greenhouse gases in 2011 were equivalent to 6,702 million metric tons of carbon dioxide.

2011 218
article thumbnail

Georgia Tech study projects potential mixed impacts of climate change policies on air quality

Green Car Congress

They used the EPA US 9-region national database (EPAUS9r) with the MARKet Allocation (MARKAL) energy system model to develop emissions scenarios and spectral nudging to downscale global climate to the regional scale over the US. lb/MWh for NO x —similar to that of new combined cycle natural gas power plants.