Remove 2017 Remove Congress Remove Economy Remove Gasoline-Electric
article thumbnail

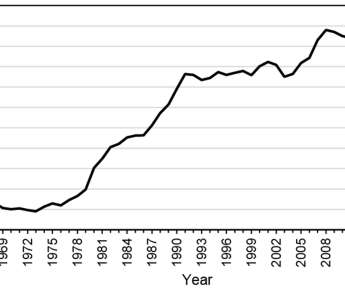
Actual fuel economy of cars and light trucks: 1966-2017

Green Car Congress

vehicle fuel economy. Specifically, this study examines actual fuel economy of cars and light trucks (pickup trucks, SUVs, and vans) from 1966 through 2017. Calculated vehicle fuel economy is available going back to 1923. Department of Transportation were the sources of the information for 1986 through 2017.

article thumbnail

Actual fuel economy of cars and light trucks: 1966-2019

Green Car Congress

vehicle fuel economy. Specifically, this study examines actual fuel economy of cars and light trucks (pickup trucks, SUVs, and vans) from 1966 through 2019. (My My previous update included data through 2017.). Calculated vehicle fuel economy is available going back to 1923. Annual statistics from the U.S.

article thumbnail

President Biden calls on Congress, States for fuel tax holiday; increase in refinery capacity

Green Car Congress

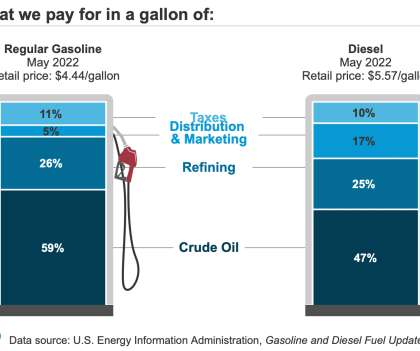
President Biden called on Congress to suspend the federal gas tax for the next 90 days, through the busy summer driving season—18 cents per gallon for gasoline and 24 cents per gallon for diesel. That figure is down from 141 refineries in 2017, with 4 idle. State gas taxes average another 30 cents per gallon.

Congress 259
article thumbnail

EPA annual inventory shows US GHG up 3.1% from 2017-2018

Green Car Congress

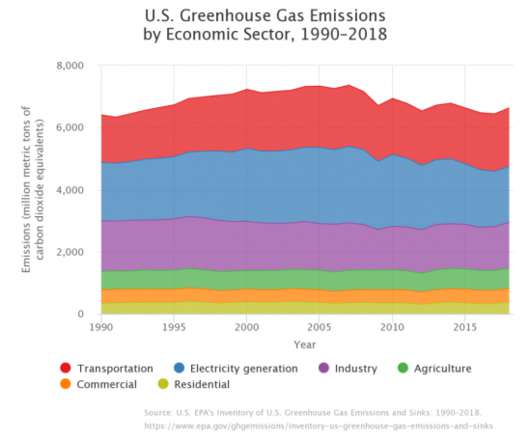
The 2020 edition of US Environmental Protection Agency’s (EPA) comprehensive annual report on nationwide greenhouse gas (GHG) emissions shows that emissions increased from 2017 to 2018 by 3.1% (after accounting for sequestration from the land sector). Source: EPA. >. Transportation sector.

2018 243
article thumbnail

California 2017 GHG inventory shows 1.2% total drop from 2016; transportation sector emissions up 1%

Green Car Congress

In 2017, emissions from GHG emitting activities statewide were 424 million metric tons of CO 2 equivalent (MMTCO 2 e), 5 MMTCO 2 e lower than 2016 levels and 7 MMTCO 2 e below the 2020 GHG Limit of 431 MMTCO 2 e. These reductions have occurred while California’s economy has continued to grow. MMTCO 2 e (6%) from 2013 to 2017.

2017 230
article thumbnail

EIA: US energy-related CO2 fell by 2.8% in 2019, slightly below 2017 levels

Green Car Congress

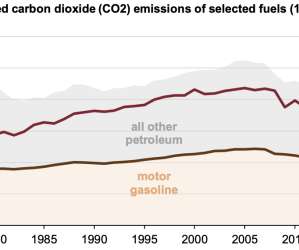
Because of continuing trends in how much energy the US economy uses and how much CO 2 that energy use generates, energy-related CO 2 emissions in 2019 fell more than energy consumption, which declined by 0.9% The United States now emits less CO 2 from coal than from motor gasoline. Total net electricity generation fell by 1.5%

2019 273
article thumbnail

EPA: US GHG fell 0.5% y-o-y in 2017; power sector down by 4.2%, transportation up 1.21%

Green Car Congress

lower in 2017 than the prior year (after accounting for sequestration from the land sector), and power sector emissions fell 4.2%, according to the 2019 edition of the US Environmental Protection Agency’s (EPA) annual report on greenhouse gas (GHG) emissions. In 2017, US greenhouse gas emissions totaled 6,456.7

2017 199