Remove 2017 Remove Climate Remove Climate Change Remove Wind
article thumbnail

New method details contributions of climate change & natural variability to rapid Arctic ice loss

Green Car Congress

The study, from the University of Washington, the University of California Santa Barbara and federal scientists, is published in Nature Climate Change. Ding designed a new sea ice model experiment that combines forcing due to climate change with observed weather in recent decades.

article thumbnail

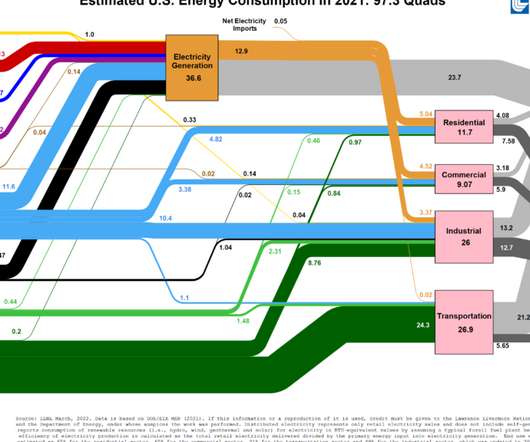
LLNL’s Energy Flow Diagrams Show That The US Isn’t Moving The Needle On Climate Action

CleanTechnica EVs

In 7 years of electrification and deployment of wind and solar, the US barely budged the needle, in fact declining slightly to more wasted energy in 2016 and 2017 before improving again in 2018 and onward.

Energy 141
article thumbnail

EEA report: EVs are better for climate and air quality

Green Car Congress

The EEA report ‘ Electric vehicles from life cycle and circular economy perspectives ’ reviews current evidence on electric cars’ impacts on climate change, air quality, noise and ecosystems, compared with conventional cars. The EEA has also published a new briefing on the environmental and climate impacts of transport.

Climate 268
article thumbnail

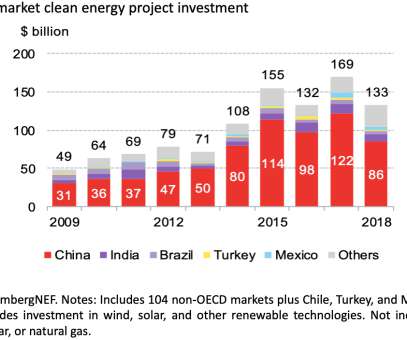
BloombergNEF: clean energy investment in developing nations slumps as financing in China slows; coal burn surges to record high

Green Car Congress

New investment in wind, solar, and other clean energy projects in developing nations dropped sharply in 2018, largely due to a slowdown in China. This is due to wind and solar projects generating only when natural resources are available while oil, coal, and gas plants can potentially produce around the clock. thousand in 2017.

Coal 243
article thumbnail

California 2017 GHG inventory shows 1.2% total drop from 2016; transportation sector emissions up 1%

Green Car Congress

In 2017, emissions from GHG emitting activities statewide were 424 million metric tons of CO 2 equivalent (MMTCO 2 e), 5 MMTCO 2 e lower than 2016 levels and 7 MMTCO 2 e below the 2020 GHG Limit of 431 MMTCO 2 e. Changes in emissions by Scoping Plan sector between 2000 and 2017. MMTCO 2 e (6%) from 2013 to 2017.

2017 230
article thumbnail

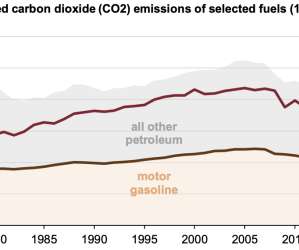
EIA: US energy-related CO2 fell by 2.8% in 2019, slightly below 2017 levels

Green Car Congress

in 2019, but power sector CO 2 emissions fell by even more (-8.2%), largely because of increases from renewable sources such as wind and solar. Because sources such as wind and solar have no fuel costs, when available, they are the first sources dispatched to meet electricity demand. Total net electricity generation fell by 1.5%

2019 273
article thumbnail

EIA: CO2 emissions from US power sector have declined 28% since 2005

Green Car Congress

US electric power sector CO 2 emissions have declined 28% since 2005 because of slower electricity demand growth and changes in the mix of fuels used to generate electricity, according to the US Energy Information Administration (EIA). Source: US EIA, US Energy-Related Carbon Dioxide Emissions , 2017.

2005 414