Remove 2004 Remove Climate Change Remove Emissions Remove Gas
article thumbnail

EPA: US GHG emissions up 6% in 2021 from 2020

Green Car Congress

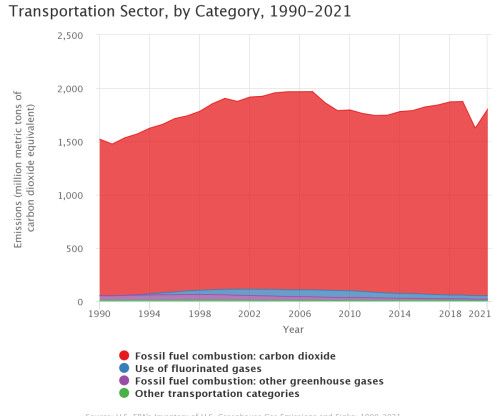
The US Environmental Protection Agency (EPA) released its 30 th annual Inventory of US Greenhouse Gas Emissions and Sinks (GHG Inventory), which presents a national-level overview of annual greenhouse gas emissions from 1990 to 2021. In 2021, US greenhouse gas emissions totaled 6,340.2 Source: EPA.

EPA 259
article thumbnail

California ARB: GHG emissions fell below 1990 levels for first time in 2016; down 13% from 2004 peak; transportation emissions up 2%

Green Car Congress

The California Air Resources Board (CARB) announced that greenhouse gas emissions in California in 2016 fell below 1990 levels for the first time since emissions peaked in 2004—a reduction roughly equivalent to taking 12 million cars off the road or saving 6 billion gallons of gasoline a year.

2004 225
article thumbnail

UCR study finds ultra-low emission natural gas bus exceeds federal and state NOx standards; as low as 0.0007g/bhp-hr

Green Car Congress

A study by the University of California, Riverside College of Engineering Center for Environmental Research and Technology (CE-CERT) found that a Los Angeles County Metropolitan Transit Agency (Metro) bus equipped with an ultra-low emission natural gas engine performs significantly cleaner than its certification standards across all duty cycles.

Standards 199
article thumbnail

EEA: increase in EU GHG emissions, mostly due to transport, hampers progress towards 2030 targets

Green Car Congress

Greenhouse gas (GHG) emissions across the European Union rose slightly in 2017, mostly because of the transport sector. emissions increase in 2017 from 2016. This limited increase means that the EU is still expected to achieve its 2020 emissions reduction target, albeit by a narrower margin. We know it can be done.

Emissions 257
article thumbnail

Oregon transit district buying 11 New Flyer electric buses and 7 ABB depot chargers

Green Car Congress

The zero-emission bus purchase was supported by Federal Transit Administration (FTA) Low or No- Emission funding. Since then, LTD hired a Sustainability Program Manager and conducted carbon footprint analysis of its operations to measure the impacts and benefits of public transit on climate change.

Oregon 312
article thumbnail

EPA’s annual automotive trends report shows slight increase in fuel economy from MY2017 to MY2018

Green Car Congress

In model year 2018, the average estimated real-world CO2 emission rate for all new vehicles fell by 4 grams per mile (g/mi) to 353 g/mi, the lowest level measured since 1975, when EPA data collection began. Since MY 2004, CO 2 emissions have decreased 23%, or 108 g/mi, and fuel economy has increased 30%, or 5.8 Source: EPA.

article thumbnail

EIA: US energy-related CO2 emissions down 1.7% in 2016; carbon intensity of economy down 3.1%; transportation emissions up

Green Car Congress

US energy-related CO 2 emissions decreased by 89 million metric tons (MMmt), from 5,259 MMmt in 2015 to 5,170 MMmt in 2016. over that period, other factors contributing to energy-related CO 2 emissions more than offset the growth in GDP, leading to a 1.7% Natural gas CO 2 emissions have increased every year since 2009.

2016 150