Remove 2000 Remove Powered Remove Transportation Remove Wind
article thumbnail

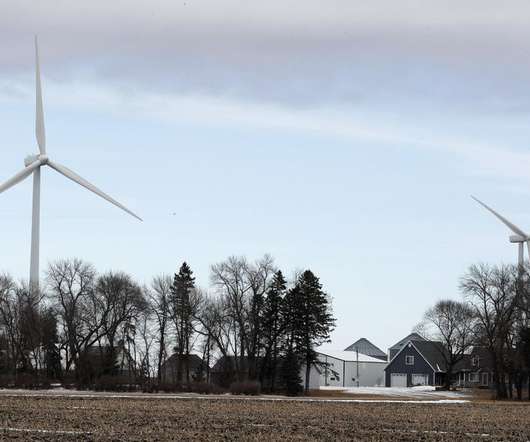
USA & China Electricity Generation TWh & CO2e Trajectories Since 2000 Are Startling

CleanTechnica EVs

For a decade I’ve been tracking the exponential expansion of wind, solar, and to a lesser extent hydro electricity generation. continued] The post USA & China Electricity Generation TWh & CO2e Trajectories Since 2000 Are Startling appeared first on CleanTechnica.

2000 90
article thumbnail

Ørsted acquiring 45% ownership of Liquid Wind FlagshipONE e-methanol project

Green Car Congress

Ørsted and Liquid Wind AB have reached an agreement under which Ørsted will acquire a 45% ownership share of Liquid Wind AB’s FlagshipONE e-methanol project. Liquid Wind AB plans to establish a series of facilities across Sweden to decarbonize the maritime sector, of which FlagshipONE will be the first. Earlier post.).

Wind 150
article thumbnail

California 2017 GHG inventory shows 1.2% total drop from 2016; transportation sector emissions up 1%

Green Car Congress

Changes in emissions by Scoping Plan sector between 2000 and 2017. The transportation sector remains the largest source of GHG emissions in the state, and saw a 1% increase in emissions in 2017. The transportation sector represents tailpipe emissions from on-road vehicles and direct emissions from other off-road mobile sources.

2017 230
article thumbnail

NTNU study finds ships’ and spare parts’ contribution to offshore wind power lifecycle impacts has been underestimated

Green Car Congress

Components: WT = wind turbine; Fnd = foundation; EC = electrical connections, including substation; Inst = installation; IOo = input-output, other; Mnt = Maintenance, excluding replacement parts; RP = replacement parts; EOL = end-of-life. ships and spare parts”—to the total life cycle impacts of offshore wind power.

Wind 199
article thumbnail

EIA: US energy-related CO2 dropped 2.7% in 2015; of end-use sectors, only transportation increased

Green Car Congress

Of the four end-use sectors, only transportation emissions increased in 2015 (+2.1%). The downward pressure on emissions was slightly offset by an uptick in transportation energy consumption that was influenced by lower fuel prices that put upward pressure on emissions. decline in energy intensity (Btu/GDP). from 2014 levels.

2015 150
article thumbnail

Tata power 2.0 is about to start Electric vehicle charging stations.

Electric Vehicles India

Tata Power is about to start a nationwide plan of setting up Electric vehicle charging stations from North to south beginning from Kashmir to Kanyakumari and from East to West, from Guwahati to Dwarka and Bikaner over the next 3-5 years downline. The move is the part of the transformation program, Tata Power 2.0, Tata Power 2.0

article thumbnail

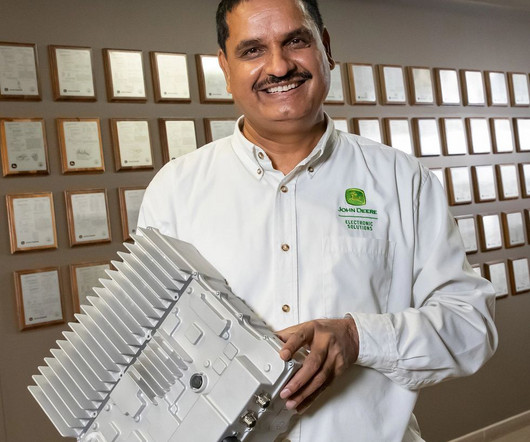
The Power Engineer Electrifying John Deere’s Tractors, Trucks, and More

Cars That Think

Singh, a power-electronics engineer, has been working to replace the internal combustion engines used in the company’s equipment with hybrid (diesel-electric) and all-electric versions. That was Singh’s job when he joined the company’s advanced power-electronics department in 2011 as a senior staff engineer.

Engine 75