Remove Gas Remove Oil Remove Oil-Sands Remove Price
article thumbnail

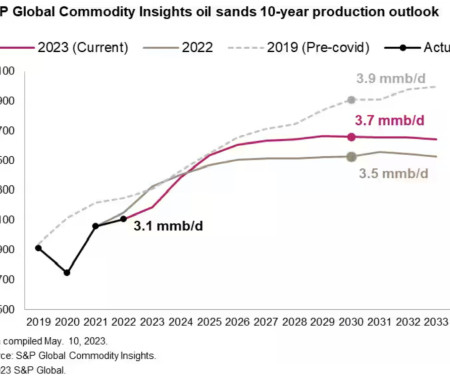
S&P Global Commodity Insights raises 10-year production outlook for Canadian oil sands

Green Car Congress

Higher crude prices and continued optimization improvements have driven the first upward revision to the S&P Global Commodity Insights 10-year oil sands production outlook in more than half a decade. Higher oil prices have driven record returns for the Canadian oil sands.

Oil-Sands 221
article thumbnail

China’s CNOOC to acquire Canada-based Nexen for $15.1B; offshore oil and gas, oil sands, and shale gas

Green Car Congress

CNOOC Limited—China’s largest producer of offshore crude oil and natural gas and one of the largest independent oil and gas exploration and production companies in the world—is acquiring all of the Common Shares of Canada-based energy company Nexen Inc. The price represents a premium of. billion cash.

Oil-Sands 325
article thumbnail

CAPP forecasts oil sands development still drives steady Canadian oil production growth to 2030

Green Car Congress

However, the new forecast represents a slowing of future oil sands production growth compared to the predictions of last year’s forecast. According to CAPP’s 2014 Crude Oil Forecast, Markets and Transportation , total Canadian crude oil production will increase to 6.4 CAPP forecast. Click to enlarge. In 2013, 1.9

Oil-Sands 199
article thumbnail

Rystad Energy: Oil sands and Arctic most expensive oil resources; NA shale putting on pressure

Green Car Congress

Oil and gas consultancy Rystad Energy estimates that oil sands and the Arctic continue to be the most expensive resources, with an average breakeven price of $75-80 per barrel of oil equivalent (boe). The break-even price of NA shale is estimated at an average of $60-70/boe. Source: Rystad Energy.

Oil-Sands 218
article thumbnail

Average carbon intensity of oil sands production has dropped ~36% in last 40 years; still 12-24% higher than conventional oil CI

Green Car Congress

The carbon intensity (CI) of Alberta oil sands production has significantly decreased over the last 40 years, according to a new study by a team from Stanford University published as an open access paper in the journal Environmental Research Letters. Trends in well-to-wheel pathway-specific CI. Click to enlarge.

Oil-Sands 210
article thumbnail

Researchers propose framework for CCS infrastructure optimization to reduce GHG emissions from oil sands extraction and processing

Green Car Congress

CCS infrastructure for six key CO 2 emission prices. The width of the pipeline network (green lines) is proportional to CO 2 flow; the largest CO 2 flow is approximately 36 MtCO 2 / yr for the $155/tCO 2 scenario (pipeline leaving the Athabasca oil sands area). Sources are red and sinks are blue. Costs are in $US 2011.

Oil-Sands 225
article thumbnail

U. Calgary analysis of energy balances and emissions of SAGD oil sands production finds need for improved processes; some operations not thermally efficient or net generators of energy

Green Car Congress

Plot of cumulative steam-to-oil ratio (cSOR) vs. ratio of energy produced in form of chemical energy contained in bitumen if combusted to energy injected in form of steam (75% efficient steam generation). One of the key challenges in producing bitumen and heavy oil is their high, variable viscosity. From Gates and Larter (2013).

Oil-Sands 337