Remove 2000 Remove CO2 Remove Emissions Remove Fuel
article thumbnail

Study: 2/3 of aviation climate impact due to emissions other than CO2

Green Car Congress

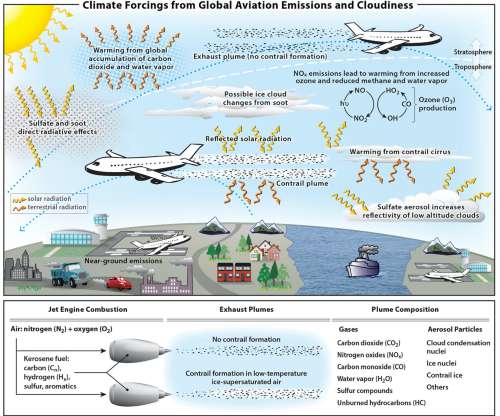
of the human-made climate impact; two-thirds of this impact are caused by emissions other than CO 2 , according to a new study by researchers in Europe and the US. This new study is based on a thorough review of a decade of research on aviation emissions. The formation and emission of sulfate aerosol yields a negative (cooling) term.

Climate 448
article thumbnail

IEA: CO2 emissions from fuel combustion rose 2.2% in 2013, below the average rate since 2000

Green Car Congress

According to the latest data released by the International Energy Agency (IEA), CO 2 emissions related to the energy sector, which is the source of nearly two-thirds of human-generated greenhouse gases, rose 2.2% Both years were below the average growth rate since 2000 of 2.5%. In absolute terms, global CO 2 emissions increased by 0.7

2000 150
article thumbnail

UK new car CO2 emissions fell 3.5% in 2010 and more than 20% since 2000

Green Car Congress

Emissions of new cars in the UK fell 3.5% Average CO 2 emissions from new cars have fallen by more than 20% since 2000. The 2010 CO 2 emissions fall is one of the highest annual reductions on record but lower than the 5.4% The 2010 CO 2 emissions fall is one of the highest annual reductions on record but lower than the 5.4%

2000 218
article thumbnail

Global CO2 emissions up 3% in 2011; per capita CO2 emissions in China reach EU levels

Green Car Congress

CO 2 per capita emissions from fossil fuel use and cement production from the top 5 emitting regions. Global emissions of CO 2 increased by 3% last year, according to the annual report “Trends in global CO 2 emissions”, released by the EC Joint Research Centre (JRC) and the Netherlands Environmental Assessment Agency (PBL).

2011 236
article thumbnail

PBL/JRC: Global CO2 emissions increase to new all-time record in 2013, but growth is slowing down

Green Car Congress

Global CO 2 emissions from fossil fuel use and cement production reached a new all-time high in 2013, according to the annual report “Trends in global CO2 emissions”, released by PBL Netherlands Environmental Assessment Agency and the European Joint Research Centre (JRC). billion tonnes (Gt). in 2013 and 3.4%

2013 240
article thumbnail

EIA releases report on CO2 emissions by state; California led in 2010 with transportation-sector emissions

Green Car Congress

Energy-related CO 2 emissions buy state, 2010. The US Energy Information Administration (EIA) has released a new report, State-Level Energy-Related Carbon Dioxide Emissions, 2000-2010. The report shows a significant variation of energy-related carbon dioxide emissions across states on both an absolute and a per capita basis.

2010 236
article thumbnail

EEA: almost all Euro car makers met specific 2017 CO2 targets on new sales, but emissions up year-on-year

Green Car Congress

All but three European car manufacturers met their specific emission targets in 2017, based on current European vehicle test rules. Nevertheless, average carbon dioxide (CO 2 ) emissions from new cars sold in the European Union in 2017 rose by 0.4g The final data show that average CO 2 emissions of a new car sold in the EU rose by 0.4

2017 170