This site uses cookies to improve your experience. To help us insure we adhere to various privacy regulations, please select your country/region of residence. If you do not select a country, we will assume you are from the United States. Select your Cookie Settings or view our Privacy Policy and Terms of Use.
Cookie Settings
Cookies and similar technologies are used on this website for proper function of the website, for tracking performance analytics and for marketing purposes. We and some of our third-party providers may use cookie data for various purposes. Please review the cookie settings below and choose your preference.
Used for the proper function of the website
Used for monitoring website traffic and interactions
Cookie Settings
Cookies and similar technologies are used on this website for proper function of the website, for tracking performance analytics and for marketing purposes. We and some of our third-party providers may use cookie data for various purposes. Please review the cookie settings below and choose your preference.
Strictly Necessary: Used for the proper function of the website
Performance/Analytics: Used for monitoring website traffic and interactions
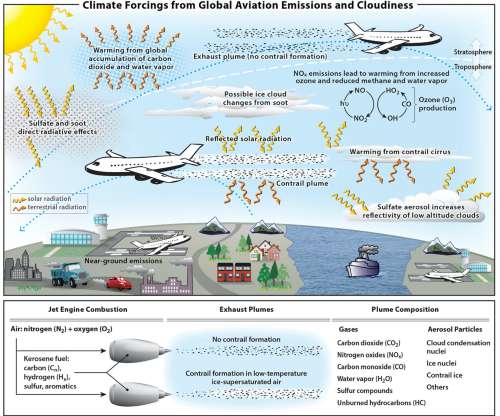
of the human-made climate impact; two-thirds of this impact are caused by emissions other than CO 2 , according to a new study by researchers in Europe and the US. This new study is based on a thorough review of a decade of research on aviation emissions. Aviation accounts for 3.5% —Marianne Tronstad Lund, co-author.
A comprehensive assessment of black-carbon climate forcing accepted for publication in the Journal of Geophysical Research: Atmospheres estimates that black carbon, with a total climate forcing of +1.1?W?m m -2 , is the second-most important human emission in terms of its climate-forcing in the present-day atmosphere.
Emissions of new cars in the UK fell 3.5% Average CO 2 emissions from new cars have fallen by more than 20% since 2000. The 2010 CO 2 emissions fall is one of the highest annual reductions on record but lower than the 5.4% The 2010 CO 2 emissions fall is one of the highest annual reductions on record but lower than the 5.4%
The decrease in CO 2 equivalent emissions of ODSs (ozone-depleting substances: CFCs, halons, HCFCs, and others) may be offset by the projected increase in their non-ozone depleting substitutes (HFCs) (lines designated as HFC scenarios). The contribution of HFCs to climate forcing is currently less than 1% of all greenhouse gases.
When peat swamps are drained for agriculture, the peat begins to decompose, and is an enormous source of carbon emissions. Mha (20%) of the peatlands of Peninsular Malaysia, Sumatra and Borneo in 2010, surpassing the area of Belgium and causing an annual carbon emission from peat decomposition of 230–310 Mt CO 2 e. Earlier post.).
A new report from the MIT Joint Program on the Science and Policy of Global Change shows the importance of all major nations taking part in global efforts to reduce emissions—and in particular, finds China’s role to be crucial. Meeting a 2 °C target is problematic unless radical GHG emission reductions are assumed in the short-term.
A recent study by an international team calculated that shipping causes a net cooling of climate across all parametrizations of the indirect aerosol effect (IAE) and scenarios throughout the period 1900?2050. A recent study commissioned by the International Maritime Organization (IMO) estimated total emissions of 1046 Tg CO 2 yr ?1
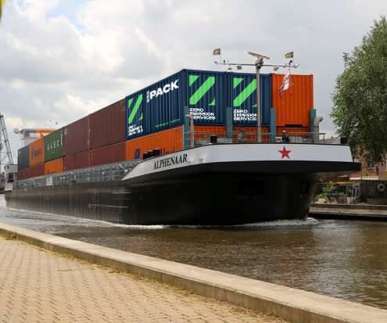
The technology group Wärtsilä has joined a consortium of key partners to form Zero Emission Services B.V. Within the Netherlands transport sector, inland navigation accounts for 5% of carbon dioxide emissions. With the help of a 2000 kWh Repack container, an inland vessel can sail for two to four hours.
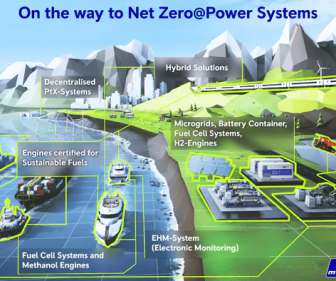
Rolls-Royce Power Systems has outlined its road map for climate neutrality: Net Zero@Power Systems. By 2030, the Rolls-Royce business unit is to cut greenhouse gas emissions by 35% compared to its 2019 level through the use of new net zero and zero carbon technologies. electricity from fossil-fired power plants).
Schematic overview of the primary black-carbon emission sources and the processes that control. the distribution of black carbon in the atmosphere and determine its role in the climate system. Accounting for all of the ways black carbon can affect climate, it is believed to have a warming effect of about 1.1 Source: Bond et al.
Significant climate anomalies 2008/2009. Source: Climate Change Compendium. Shifts in the hydrological cycle resulting in the disappearance of regional climates with related losses of ecosystems, species and the spread of drylands northwards and southwards away from the equator. Global emissions were growing by 1.1%
Radiative forcing due to perpetual constant year 2000emissions grouped by sector for 2020 (left) and 2100 (right) showing the contribution from each species. This approach will make it easier to identify sectors for which emission reductions will be most beneficial for climate and those which may produce unintended consequences.”.
Black carbon emissions and BC emissions intensity per year. A study led by a team from Peking University has estimated that global black carbon (BC) emissions increased from 5.3 The Fifth Assessment Report of the Intergovernmental Panel on Climate Change (IPCC) said BC has a direct radiative forcing of +0.4 (+0.05
Global sulfur dioxide emissions by region. Sulfur aerosols impact human health, ecosystems, agriculture, and global and regional climate. While the overall global uncertainty in sulfur dioxide emissions is relatively small, regional uncertainties ranged up to 30%. Emissions were distributed on a 0.5° Credit: Smith et al.
Global carbon dioxide emissions from burning fossil fuels have increased by 49% in the last two decades, according to the latest figures from the Global Carbon Project. Total emissions—including fossil fuel combustion, cement production, deforestation and other land use emissions—reached 10 billion tonnes of carbon (36.7
Energy-related carbon-dioxide (CO2) emissions in 2010 were the highest in history, according to the latest estimates by the International Energy Agency (IEA). After a dip in 2009 caused by the global financial crisis, emissions are estimated to have climbed to a record 30.6 tonnes for China, and 1.5 tonnes in India. Earlier post.).
Daimler AG has received top marks for disclosure of its climate protection measures aimed at combating climate change, receiving the maximum 100 points in the Carbon Disclosure Project’s (CDP’s) “Climate Disclosure Leadership Index” and an “A” rating in the “Climate Performance Leadership Index”.
Despite the economic effects of the global financial crisis (GFC), carbon dioxide emissions from human activities rose 2% in 2008 to an all-time high of 1.3 Other main findings of the study include: CO 2 emissions from the burning of fossil fuels have increased at an average annual rate of 3.4% over the previous seven years.
Decomposition of the decadal change in total global CO 2 emissions from fossil fuel combustion by four driving factors; population, income (GDP) per capita, energy intensity of GDP and carbon intensity of energy. giga tonne carbon dioxide equivalent (GtCO 2 eq) (2.2%) per year from 2000 to 2010 compared to 0.4 Click to enlarge.
Energy-related CO 2 emissions buy state, 2010. The US Energy Information Administration (EIA) has released a new report, State-Level Energy-Related Carbon Dioxide Emissions, 2000-2010. The report shows a significant variation of energy-related carbon dioxide emissions across states on both an absolute and a per capita basis.
Global accounting firm PricewaterhouseCoopers has analyzed carbon emissions from 2000 to 2008 and concluded that the world’s “carbon emissions budget”, or ability to emit carbon dioxide while still maintaining a “fair chance” of limiting average global temperatures to no more than 2 ºC (3.6
Transport emissions could double their current relative net contribution to global warming by 2100, according to a new study by researchers at the Oslo-based Centre for International Climate and Environment Research (CICERO) in Norway. More travelling and international trade drive the emission increase. million (US$12.6
The US Environmental Protection Agency (EPA) has submitted its final Report to Congress on Black Carbon , in response to an October 2009 request from Congress to advance efforts to understand the role of black carbon (BC) in climate change. Effects of BC on climate, as compared to GHGs. Earlier post.). Earlier post.). Source: EPA.
Projected changes in summer mean usable capacity of power plants in the US and Europe for the SRES A2 emissions scenario for the 2040s (2031–2060) relative to the control period (1971–2000). A study published in Nature Climate Change suggests that thermoelectric power plants (i.e., Source: van Vliet et al. Click to enlarge.
Evolution of the carbon dioxide emissions calculated by the model (left) and the temporal development of the global mean annual temperature (right). In order to achieve the long-term stabilization of the atmospheric carbon dioxide concentration, fossil carbon dioxide emissions must be reduced to around zero by the end of the century.
According to the latest data released by the International Energy Agency (IEA), CO 2 emissions related to the energy sector, which is the source of nearly two-thirds of human-generated greenhouse gases, rose 2.2% Both years were below the average growth rate since 2000 of 2.5%. In absolute terms, global CO 2 emissions increased by 0.7
Factors contributing to the 7% drop in emissions in 2009. While emissions have declined in three out of the last four years, EIA noted, 2009 was “ exceptional ”. Since 2000, the carbon intensity of energy used in the two sectors has not decreased (or improved) by as much as 2 percent. Emissions by end-use sector, 2008 and 2009.
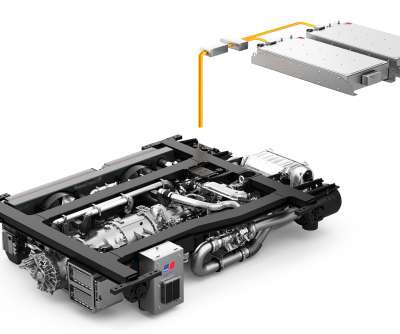
Rolls-Royce, Porterbrook and Chiltern Railways have put a hybrid diesel-battery-electric train that reduces CO 2 emissions by up to 25% into passenger service in the UK. The partners are proving that existing rail vehicles can be used in a climate-friendly way without the need to install complex and expensive new infrastructure.
A recent increase in the abundance of particles high in the atmosphere has offset about a third of the current climate warming influence of CO 2 change during the past decade, according to a new study led by NOAA and published in the online edition of Science. The increase in aerosols since 2000 implies a cooling effect of about 0.1
Current emissions of anthropogenic greenhouse gases (GHGs) have already committed the planet to an increase in average surface temperature by the end of the century that may be above the critical threshold for tipping elements of the climate system into abrupt change with potentially irreversible and unmanageable consequences, the authors write.
Anthropogenic global greenhouse gas emissions increased by 15% between 2000 and 2005, a sharp increase in the expected rate of growth, according to a new report from the European Commission’s Joint Research Centre (JRC). It also provides data on greenhouse-gas emissions for the 20 years preceding the 1990 Kyoto protocol.
CO 2 per capita emissions from fossil fuel use and cement production from the top 5 emitting regions. Global emissions of CO 2 increased by 3% last year, according to the annual report “Trends in global CO 2 emissions”, released by the EC Joint Research Centre (JRC) and the Netherlands Environmental Assessment Agency (PBL).
California’s latest greenhouse gas data shows that while the state continues to stay below its 2020 target for emissions, there is much more work to do to achieve carbon neutrality by 2045. California statewide GHG emissions dropped below the 2020 GHG Limit in 2016 and have remained below the 2020 GHG Limit since then.
A new brief published by the International Transport Forum (ITF)—an intergovernmental organization at the OECD with 59 member countries— identifies proven measures that decrease road freight’s CO 2 emissions. This will offset any expected efficiency gains and lead to an increase in emissions by 2050, not a reduction.
Global carbon dioxide emissions show no sign of abating and may reach record levels in 2010, according to a study led by the University of Exeter (UK). The global financial crisis severely affected western economies, leading to large reductions in CO 2 emissions. For example, UK emissions were 8.6% below the record 2008 figures.
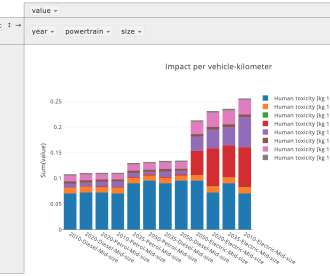
The entire life cycle of the passenger cars is taken into account, including the manufacture of the vehicles and the environmentally relevant emissions from driving. The system will graph lifecycle impact for a range of specified powertrains, for a large number of impact categories: Climate change [kg CO 2 -eq.]. in review).
ExxonMobil will invest up to $100 million over 10 years to research and to develop advanced lower-emissions technologies with the US Department of Energy’s National Renewable Energy Laboratory and National Energy Technology Laboratory. The joint research will also focus on reducing emissions from fuels and petrochemicals production.
While natural gas can reduce greenhouse emissions when it is substituted for higher-emission energy sources, abundant shale gas is not likely to substantially alter total emissions without policies targeted at greenhouse gas reduction, according to a new study by two researchers at Duke University. —Newell and Raimi.
Effects of changes in the average lifespan of ordinary passenger cars newly registered between 1990-2000 on total induced CO 2 emissions in 2000. Conversely, encouraging shortened vehicle lifetime via vehicle replacement schemes can result in higher total-induced greenhouse gas emissions, the authors found.
In its sixth sales-weighted analysis of emissions from 8 major automakers’ 2013 model year vehicles, the Union of Concerned Scientists’ (UCS) latest Automaker Rankings report found that Hyundai-Kia unseated Honda as the “Greenest Automaker.” Click to enlarge. Source: UCS. Click to enlarge.
Global CO 2 emissions from fossil fuel use and cement production reached a new all-time high in 2013, according to the annual report “Trends in global CO2 emissions”, released by PBL Netherlands Environmental Assessment Agency and the European Joint Research Centre (JRC). In 2013, global CO 2 emissions grew to the new record of 35.3
Europe’s transport sector is making only mixed progress in meeting its environment, health and climate policy targets, according to the latest European Environment Agency (EEA) assessment which tracks the short and long-term environmental performance of this key economic sector across the European Union. Source: EEA. Click to enlarge.
Temperature change per transport work by mode for various years after the emissions: per passenger kilometer for passenger travel (left) and per ton-kilometer for freight transport (right). Global average values for the year 2000. Bars represent 1 SD. Credit: ACS, Borken-Kleefeld et al. Click to enlarge.
C (1.26 °F) since 1960 and other observed changes in rainfall, sea level rise, ocean acidification and atmospheric CO 2 concentration show that “ climate change is real ”, according to a joint CSIRO/Bureau of Meteorology (BOM) statement and snapshot of the state of the country’s climate. C, 0.72 °F). F] by 2030. to 9 °F] by 2070.
We organize all of the trending information in your field so you don't have to. Join 5,000+ users and stay up to date on the latest articles your peers are reading.
You know about us, now we want to get to know you!
Let's personalize your content
Let's get even more personalized
We recognize your account from another site in our network, please click 'Send Email' below to continue with verifying your account and setting a password.


Let's personalize your content