Remove Market Remove Personal Remove Statistics Remove Universal
article thumbnail

CMU-led study finds that when Uber and Lyft enter cities, vehicle ownership increases

Green Car Congress

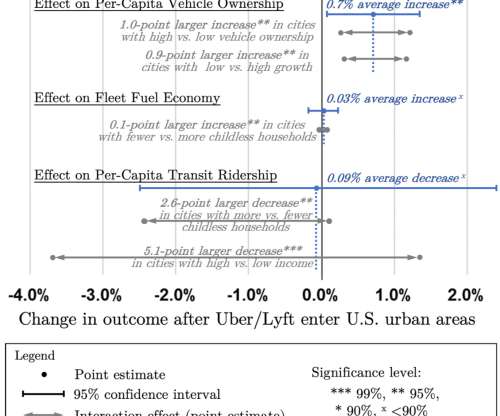
on average, increasing even more in car-dependent cities, according to a new study led by researchers at Carnegie Mellon University. Visual summary of regression model findings estimating TNC market entry effects on vehicle ownership, fuel economy, and transit ridership. —CMU Professor Jeremy Michalek, corresponding author.

article thumbnail

Does e-commerce affect the amount of travel in the United States?

Green Car Congress

Bureau of Labor Statistics. Average time spent traveling per day for all persons in connection with purchasing goods and services. Average time spent traveling per day for all persons in connection with purchasing goods and services. The data used are for persons 15 years of age and older, and they apply to all days of the week.

article thumbnail

Distances traveled on the road and in the air: 1970-2015

Green Car Congress

Furthermore, the focus here is not on total distances but on distances per person, because the U.S. The calculated average passenger-distances traveled per person are shown in the table below, along with the average occupancy rates from the Bureau of Transportation Statistics.

2015 275
article thumbnail

Great Britain and the United States show the same pattern of recent changes in vehicle distance traveled

Green Car Congress

Vehicle distance traveled per person in Great Britain is currently about one-half of the distance in the United States. statistics segment road vehicles differently, the data are for all road vehicles. statistics segment road vehicles differently, the data are for all road vehicles. (I The years examined were 1993 through 2018.

article thumbnail

TRB releases new report identifying deficiencies impacting e-scooter rider safety

Green Car Congress

The research was conducted by the University of North Carolina at Chapel Hill in conjunction with the University of Tennessee, Knoxville; Safe Streets Research and Consulting; Equitable Cities; and Populus. Personal ownership of e-scooters is also growing and projected to increase throughout this decade.

article thumbnail

How men and women differ in their travel patterns

Green Car Congress

Bureau of Labor Statistics. The analysis used the following two variables from ATUS: Average percentage of persons traveling (using any travel mode) per day by activity. Average hours spent traveling per day by activity for persons who traveled in connection with the activity. Personal care. vs. 31.1%). vs. 31.1%).

Personal 268
article thumbnail

Flying declined substantially more than driving during the current pandemic

Green Car Congress

The raw data for the analysis came from the Bureau of Transportation Statistics (revenue passenger miles flown on all scheduled domestic flights) and the Federal Highway Administration (vehicle miles traveled). The results are shown in the table below. Two caveats are in order.