This site uses cookies to improve your experience. To help us insure we adhere to various privacy regulations, please select your country/region of residence. If you do not select a country, we will assume you are from the United States. Select your Cookie Settings or view our Privacy Policy and Terms of Use.
Cookie Settings
Cookies and similar technologies are used on this website for proper function of the website, for tracking performance analytics and for marketing purposes. We and some of our third-party providers may use cookie data for various purposes. Please review the cookie settings below and choose your preference.
Used for the proper function of the website
Used for monitoring website traffic and interactions
Cookie Settings
Cookies and similar technologies are used on this website for proper function of the website, for tracking performance analytics and for marketing purposes. We and some of our third-party providers may use cookie data for various purposes. Please review the cookie settings below and choose your preference.
Strictly Necessary: Used for the proper function of the website
Performance/Analytics: Used for monitoring website traffic and interactions
The Rhodium Group, an independent research provider, estimates that, after a sharp uptick in 2018, US greenhouse gas (GHG) emissions fell by 2.1% This decline was due almost entirely to a drop in coal consumption. Coal-fired power generation fell by a record 18% year-on-year to its lowest level since 1975.
A multi-Hubbert analysis of coal production by Tadeusz Patzek at The University of Texas at Austin and Gregory Croft at the University of California, Berkeley concludes that the global peak of coal production from existing coalfields will occur close to the year 2011. The CO 2 emissions from burning this coal will also decline by 50%.
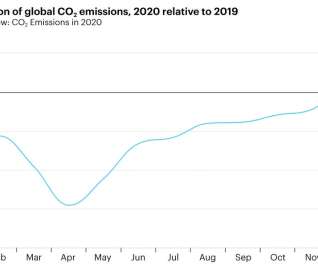
The Covid-19 crisis in 2020 triggered the largest annual drop in global energy-related carbon dioxide emissions since the Second World War, according to IEA data, but the overall decline of about 6% masks wide variations depending on the region and the time of year. Many economies are now seeing emissions climbing above pre-crisis levels.
US electric power sector CO 2 emissions have declined 28% since 2005 because of slower electricity demand growth and changes in the mix of fuels used to generate electricity, according to the US Energy Information Administration (EIA). Source: US EIA, US Energy-Related Carbon Dioxide Emissions , 2017.
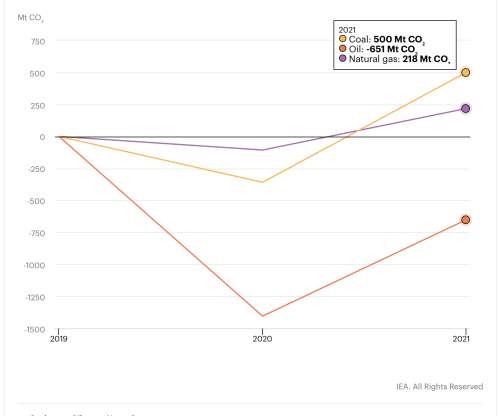
Global energy-related carbon dioxide emissions rose by 6% in 2021 to 36.3 billion tonnes, their highest ever level, as the world economy rebounded strongly from the COVID-19 crisis and relied heavily on coal to power that growth, according to new IEA analysis. In 2021 alone, China’s CO 2 emissions rose above 11.9 billion tonnes.
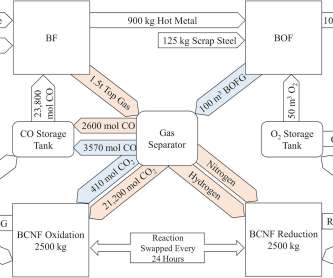
Researchers from the University of Birmingham have designed a novel adaptation for existing blast furnaces that could reduce CO 2 emissions from the steelmaking industry by nearly 90%. billion in 5 years while reducing overall UK emissions by 2.9%. If implemented in the UK alone, the system could deliver cost savings of £1.28
Life-cycle GHG emissions from fossil and alternative sources of electricity. Lead author Kharecha and colleagues note that current climate science indicates that atmospheric CO 2 concentrations, already at 387 ppm in 2009 and rising, need to be reduced to no more than 350 ppm. Credit: ACS, Kharecha et al. Click to enlarge.
The top graph depicts CTL in a no policy scenario; the bottom graph, for CTL in a world climate policy scenario. However, the viability of CTL becomes quite limited in regions with climate policy due to the high conversion cost and huge carbon footprint. of global electricity demand. Credit: Chen et al., 2011 Click to enlarge.
NYK Line, Japan Marine United Corporation (JMU), and Nippon Kaiji Kyokai (ClassNK) signed a joint R&D agreement for the commercialization of an ammonia-fueled ammonia gas carrier (AFAGC) that would use ammonia as the main fuel, in addition to an ammonia floating storage and regasification barge (A-FSRB).
The US Environmental Protection Agency (EPA) released its 28 th annual Inventory of US Greenhouse GasEmissions and Sinks (GHG Inventory), which presents a national-level overview of annual greenhouse gasemissions from 1990 to 2019. CO 2 emissions decreased 2.2% Total GHG emissions in 2019 were up 1.8%
Technology warming potential (TWP) for three sets of natural gas fuel-switching scenarios. (A) A) CNG light-duty cars vs. gasoline cars; (B) CNG heavy-duty vehicles vs. diesel vehicles; and (C) combined-cycle natural gas plants vs. supercritical coal plants using low-CH 4 coal. Source: Alvarez et al. Click to enlarge.
Life-cycle GHG emissions per MJ of fuel produced and combusted for both 100-year and 20-year time horizons. However, the range in values for shale and conventional gas overlap, so there is a statistical uncertainty whether shale gasemissions are actually lower than those of conventional natural gas.
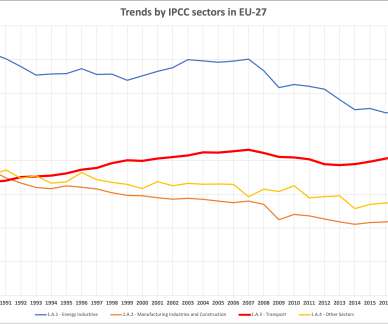
Total greenhouse gasemissions in the European Union (EU) decreased by 3.8% The large decline in emissions, achieved before the COVID-19 crisis, was mainly due to reduced coal use for power generation. This decrease brought EU emissions to 24.0% from 2018 to 2019.
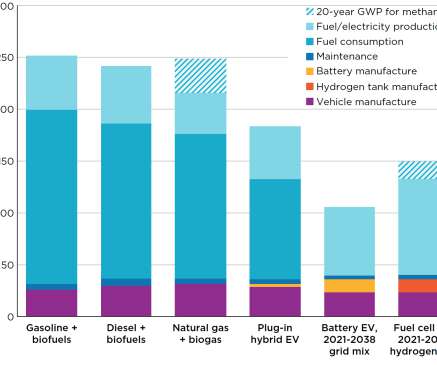
The ICCT has conducted a comprehensive global and temporal life-cycle assessment of GHG emissions from a variety of alternative passenger car powertrains and fuels. The life-cycle GHG emissions of cars registered in 2021 are compared with those of cars expected to be registered in 2030.
Natural gas will play a leading role in reducing greenhouse-gasemissions over the next several decades, largely by replacing older, inefficient coal plants with highly efficient combined-cycle gas generation, according to a major new interim report out from MIT.
US CO 2 emissions growth. In its current version of the Short Term Energy Outlook ( STEO ), the US Energy Information Administration projects a 5% decline in fossil-fuel-based CO 2 emissions in 2009. decrease in CO 2 emissions from fossil fuels in 2008. decline in coal-based CO 2 emissions for 2009. Natural Gas.
India’s energy landscape is at a pivotal crossroads, exemplified by the notable recent decline in coal- and gas-fired power generation, which in May 2025 marked the steepest year-over-year drop since COVID-19.
Although hydropower is broadly considered to be much more environmentally friendly than electricity generated from fossil fuels (e.g., Although hydropower is broadly considered to be much more environmentally friendly than electricity generated from fossil fuels (e.g., They also estimated emissions caused by flooding the reservoir.
In regions where the share of coal-based electricity is relatively low, EVs can achieve substantial GHG reduction, the team reports in a paper in the ACS journal Environmental Science & Technology. emissions are less important because of the low contribution of light duty vehicles to national PM 10 and PM 2.5
Battery electric cars emit less greenhouse gases and air pollutants over their entire life cycle than petrol and diesel cars, according to a European Environment Agency (EEA) report. Emissions are usually higher in the production phase of electric cars, but these are more than offset by lower emissions in the use phase over time.
Among the transportation-related elements of US President Barack Obama’s new climate action plan, which he is outlining today in a speech at Georgetown University, is the development of new fuel economy standards for heavy-duty vehicles post-2018. Preparing the US for the impacts of climate change. Earlier post.).
The US Environmental Protection Agency (EPA) has proposed Clean Air Act standards to reduce CO 2 emissions from fossil-fuel fired power plants (electric utility generating units, EGUs). The proposed rulemaking establishes separate standards for natural gas and coal plants.
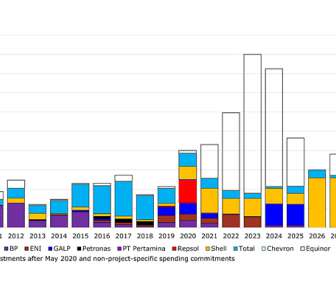
An analysis of near-term spending plans on renewables by the biggest oil and gas companies shows that real investments in renewable energy will continue to pale in comparison to capex plans for greenfield fossil fuel projects. Indeed, much of Big Oil's reduction in greenhouse gas (GHG) emissions leans on the so-called natural gas bridge.
Stroll, play, talk, celebrate -do whatever you want on the public street without sucking up gas fumes or fearing for your life from drunk drivers, texting drivers, drivers eating or putting on makeup or just plain dangerous behind the wheel lunatics. It’s long been time to kick coal out of L.A.’s
One possible scenario for the electricity system in the Western US in 2026-29. Their analysis also found that current renewable portfolio standards (RPS) are insufficient to meet emission reduction targets by 2030 without new policy. To meet these carbon goals, coal has to go away from the region. Click to enlarge.
All large-scale energy systems have environmental impacts, and the ability to compare the impacts of renewable energy sources is an important step in planning a future without coal or gas power. In the journal Joule , Harvard researchers report the most accurate modelling yet of how increasing wind power would affect climate.
However, this research finds that it reduces only a small fraction of carbon emissions, and it usually increases air pollution. In both plants, natural gas turbines power the equipment. Upstream emissions are emissions, including from leaks and combustion, from mining and transporting a fuel such as coal or natural gas.).
While natural gas can reduce greenhouse emissions when it is substituted for higher-emission energy sources, abundant shale gas is not likely to substantially alter total emissions without policies targeted at greenhouse gas reduction, according to a new study by two researchers at Duke University.
Overview of the bluegas catalytic coal methanation process. The projects would be developed using GreatPoint’s proprietary bluegas technology, which utilizes catalytic hydromethanation to create pure hydrogen and substitute natural gas (SNG) that is pipeline-ready in a single-stage gasification process. Click to enlarge.
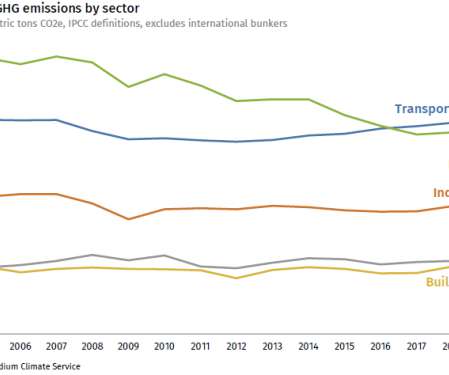
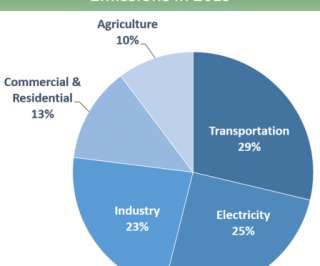
greenhouse gasemissions were 6,472.3 from 2016, according to the US Environmental Protection Agency’s (EPA’s) latest Greenhouse Gas Inventory. The decrease in total greenhouse gasemissions between 2016 and 2017 was driven in part by a decrease in CO 2 emissions from fossil fuel combustion. Transportation.
Chairman of the Homeland Security and Governmental Affairs Committee, released the details of their long-anticipated energy and climate change legislation on Wednesday, 12 May. According to the recently finalized Inventory of US Greenhouse GasEmissions and Sinks: 1990-2008 , net US GHG emissions in 2008 were down 2.7%
Greenhouse gas (GHG) emissions across the European Union rose slightly in 2017, mostly because of the transport sector. emissions increase in 2017 from 2016. This limited increase means that the EU is still expected to achieve its 2020 emissions reduction target, albeit by a narrower margin. We know it can be done.
Greenhouse gasemissions in the US economy, 2008. Total US greenhouse gasemissions in 2008 were 2.2% below the 2007 total, according to the just-released report by the US Energy Information Administration, Emissions of Greenhouse Gases in the United States 2008. The decline in total emissions—from 7,209.8
US consumers of electricity should be willing to pay, on average, $0.24–$0.45/kWh—approximately US consumers of electricity should be willing to pay, on average, $0.24–$0.45/kWh—approximately They provide figures based on state electricity profiles, national averages and fossil fuel type. The high (?)
Factors contributing to the 7% drop in emissions in 2009. While emissions have declined in three out of the last four years, EIA noted, 2009 was “ exceptional ”. Carbon intensity changes in the electric power and industrial end use sectors. from 2008 to 2009 while the comparable price of natural gas fell 48% on a per Btu basis.
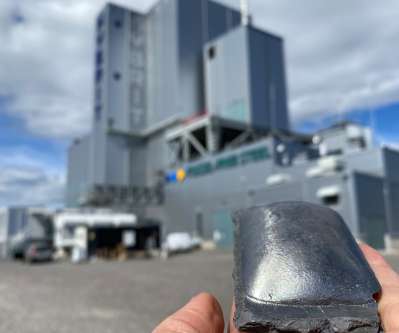
The technological breakthrough within the HYBRIT ( earlier post ) initiative cuts about 90% of the emissions in connection with steel production and is a decisive step on the road to fossil-free steel. This marks the first time that iron ore has been directly reduced with hydrogen produced with fossil-free electricity on a pilot scale.
CO 2 per capita emissions from fossil fuel use and cement production from the top 5 emitting regions. Global emissions of CO 2 increased by 3% last year, according to the annual report “Trends in global CO 2 emissions”, released by the EC Joint Research Centre (JRC) and the Netherlands Environmental Assessment Agency (PBL).
The California Air Resources Board (CARB) announced that greenhouse gasemissions in California in 2016 fell below 1990 levels for the first time since emissions peaked in 2004—a reduction roughly equivalent to taking 12 million cars off the road or saving 6 billion gallons of gasoline a year.
The President’s Council of Advisors on Science and Technology (PCAST) released a letter to President Obama describing six key components the advisory group believes should be central to the Administration’s strategy for addressing climate change. Both approaches are essential parts of an integrated strategy for dealing with climate change.
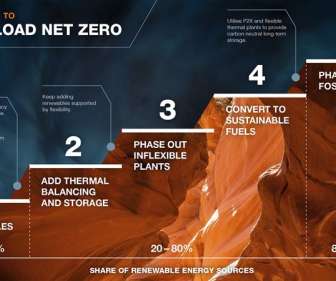
The technology group Wärtsilä has issued a report ahead of COP26, the UN’s Climate Change Conference to be held in Glasgow this autumn, describing the environmental and economic opportunities for states that decarbonize rapidly. coal and gas), significantly reducing the overall levelised cost of electricity.
Carbon dioxide emissions from S energy consumption will remain near current levels through 2050, according to projections in EIA’s Annual Energy Outlook 2019. USenergy-related carbon dioxide emissions and fossil fuel energy consumption. Energy-related CO 2 emissions generally follow energy consumption trends.
Energy-related CO 2 emissions buy state, 2010. The US Energy Information Administration (EIA) has released a new report, State-Level Energy-Related Carbon Dioxide Emissions, 2000-2010. The report shows a significant variation of energy-related carbon dioxide emissions across states on both an absolute and a per capita basis.
A team at George Washington University has demonstrated a new solar process that can produce lime (CaO) for cement without any emission of carbon dioxide, and at lower projected cost than the existing cement industry process. The majority (about 60%) of those CO 2 emissions result from the production of lime. —Licht et al.
Global energy-related carbon dioxide emissions were flat for a third straight year in 2016 even as the global economy grew, according to the International Energy Agency. The data signal a continuing decoupling of emissions and economic activity. Global emissions from the energy sector stood at 32.1
We organize all of the trending information in your field so you don't have to. Join 5,000+ users and stay up to date on the latest articles your peers are reading.
You know about us, now we want to get to know you!
Let's personalize your content
Let's get even more personalized
We recognize your account from another site in our network, please click 'Send Email' below to continue with verifying your account and setting a password.


Let's personalize your content