This site uses cookies to improve your experience. To help us insure we adhere to various privacy regulations, please select your country/region of residence. If you do not select a country, we will assume you are from the United States. Select your Cookie Settings or view our Privacy Policy and Terms of Use.
Cookie Settings
Cookies and similar technologies are used on this website for proper function of the website, for tracking performance analytics and for marketing purposes. We and some of our third-party providers may use cookie data for various purposes. Please review the cookie settings below and choose your preference.
Used for the proper function of the website
Used for monitoring website traffic and interactions
Cookie Settings
Cookies and similar technologies are used on this website for proper function of the website, for tracking performance analytics and for marketing purposes. We and some of our third-party providers may use cookie data for various purposes. Please review the cookie settings below and choose your preference.
Strictly Necessary: Used for the proper function of the website
Performance/Analytics: Used for monitoring website traffic and interactions
Ozone, the main component of smog, is a plant-damaging pollutant formed by emissions from vehicles, cooking stoves and other sources. New research shows that ozone pollution damaged millions of tons of wheat, rice, soybean and cotton crops in India in 2005. Surface ozone pollution in India damaged 6 million metric tons (6.7
Ozone pollution near Earth’s surface is one of the main ingredients of summertime smog. It is also not directly measurable from space due to the abundance of ozone higher in the atmosphere, which obscures measurements of surface ozone. —Jin et al.
The Bakken Formation, a shale oil and gas field in North Dakota and Montana, is emitting roughly 2% (about 250,000 tons per year) of the globe’s ethane, according to new study led by researchers at the University of Michigan. Between 2005 and 2014, the Bakken’s oil production jumped by a factor of 3,500, and its gas production by 180.
Despite reports that global emissions of the potent greenhouse gas, HFC-23, were almost eliminated in 2017, an international team of scientists, led by the University of Bristol, has found atmospheric levels growing at record values. This would have been a big win for climate. —co-author Dr Matt Rigby.
eutrophication; ET = ecological toxicity; FEC = fossil energy consumption; WU = water use; LO = land occupation; “The rest” includes acidification; smog formation; ozone layer depletion; and human health effects. GW = global warming; Eut. Credit: ACS, Yang et al. Click to enlarge. Credit: ACS, Yang et al. Click to enlarge.
They found that levels of pollutants that can contribute to the formation of ground-level ozone, or smog, have failed to continue a fairly steady decline as estimated by the US Environmental Protection Agency. These results show that meeting future air quality standards for ozone pollution will be more challenging than previously thought.
They estimated year-2005 North American ethanol emissions of 670 GgC/y, with 440 GgC/y from the continental US. This is accompanied by a modest regional decrease in surface ozone (of order 1%). Numbers inset give the total North American ethanol source. Labels at left are months (e.g., DJF = December, January, February).
Although China and India remain the world’s largest consumers of coal, a new University of Maryland-led study found that China’s sulfur dioxide emissions fell by 75% since 2007, while India’s emissions increased by 50%. The results suggest that India is becoming, if it is not already, the world’s top sulfur dioxide emitter.
These were shown to be ozone-depleting, however, and were targeted for phasing out under the 1987 Montreal Protocol. However, HFC-134a, while having zero ozone-depletion potential, has a very high global warming potential—more than 1,500 times as much warming as an equivalent amount of CO 2. Cambridge University Press.
Mikhail Chester and Arpad Horvath inventoried on-road, rail, and air travel to determine energy consumption, greenhouse gas (GHG) emissions, and criteria air pollutant (CAP) emissions (excluding PM, lead, and ozone due to lack of data). Chester and Horvath (2009). Click to enlarge.
The program reduces the number of available allowances issued each year to ensure that aggregate emissions from the covered entities are reduced by 3% below 2005 levels in 2012, 20% below 2005 levels in 2020, 42% below 2005 levels in 2030, and 83% below 2005 levels in 2050. Supplemental Pollution Reductions.
Other ancillary studies were led by Dr. Jeffrey Bemis, of Litron Laboratories, Rochester, New York; Dr. Lance Hallberg, of the University of Texas Medical Branch, Galveston, Texas; and Dr. Daniel Conklin, of the University of Louisville, Louisville, Kentucky. These ancillary studies evaluated endpoints not examined in the core study.
In 2004, the Centralina region (the Greater Charlotte metro area, which straddles the North CarolinaSouth Carolina border) was designated as a non-attainment area for ozone under the Clean Air Act. program at the University of Pisa in Italy, the ancient university where Galileo taught. Where does hydrail stand at present?
and ozone deaths, associated mortality rates, and population in G20 economies in 2015. and ozone worldwide in 2010 and ~385,000 in 2015, equivalent to 11.7% and ozone premature deaths in 2010 and 11.4% and ozone concentrations from transportation emissions resulted in 7.8 Transportation-attributable PM 2.5 Together, PM 2.5
Long-term exposure to ambient air pollutants, especially O 3 (ozone), is significantly associated with increasing emphysema, according to a new study led by the University of Washington, Columbia University and the University at Buffalo. The annual averages of ozone levels in study areas were between about 10 and 25 ppb.
1,000 to 21,000) deaths due to changes in ozone concentrations. 900 to 11,000) ozone-related early deaths per year. 300 to 4,000) ozone-related premature mortalities per year. 2000 (90% CI: 0–4,000) early deaths from ozone, according to the study. 53,000 (90% CI: 24,000–95,000) PM 2.5 related premature deaths and ?5,000
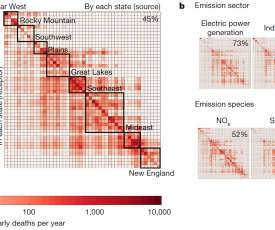
The study focuses on the period between 2005 and 2018 and tracks combustion emissions of various polluting compounds from various sectors, looking at every state in the contiguous United States, from season to season and year to year. They first obtained emissions data from each of seven sectors for the years 2005, 2011, and 2018.
In 2005, their sales increased even further, accounting for approximately 54% of all new car sales. 80.27, “high ozone season” means the period from June 1 to September 15 of any calendar year and “regulatory control period” means the period from May 1 to September 15 of any calendar year. 40 CFR § 80.27 Pursuant to 40 CFR § 80.27(a)(2):
We organize all of the trending information in your field so you don't have to. Join 5,000+ users and stay up to date on the latest articles your peers are reading.
You know about us, now we want to get to know you!
Let's personalize your content
Let's get even more personalized
We recognize your account from another site in our network, please click 'Send Email' below to continue with verifying your account and setting a password.


Let's personalize your content