Remove 2000 Remove Climate Change Remove Oil Remove Transportation
article thumbnail

USA & China Electricity Generation TWh & CO2e Trajectories Since 2000 Are Startling

CleanTechnica EVs

continued] The post USA & China Electricity Generation TWh & CO2e Trajectories Since 2000 Are Startling appeared first on CleanTechnica. For a decade I’ve been tracking the exponential expansion of wind, solar, and to a lesser extent hydro electricity generation.

2000 87
article thumbnail

California 2017 GHG inventory shows 1.2% total drop from 2016; transportation sector emissions up 1%

Green Car Congress

Changes in emissions by Scoping Plan sector between 2000 and 2017. The transportation sector remains the largest source of GHG emissions in the state, and saw a 1% increase in emissions in 2017. The transportation sector represents tailpipe emissions from on-road vehicles and direct emissions from other off-road mobile sources.

2017 230
article thumbnail

New study finds GHG emissions from palm oil production significantly underestimated; palm oil biofuels could be more climate-damaging than oil sands fuels

Green Car Congress

Based on visual interpretation of high-resolution (30 m) satellite images, a new study in the journal Global Change Biology: Bioenergy determined that industrial plantations covered over 3.1 Slightly more than half of the GHG emissions for these biofuels in the EPA’s analysis came from land use change. Earlier post.).

Oil-Sands 314
article thumbnail

PSI team develops web tool for consumers to compare environmental impact of passenger cars in detail

Green Car Congress

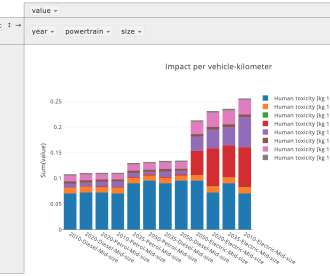
The system will graph lifecycle impact for a range of specified powertrains, for a large number of impact categories: Climate change [kg CO 2 -eq.]. Depletion of fossil energy resources [kg oil-eq.]. The top sample above shows climate change impact; the subsequent chart shows human toxicity. —Romain Sacchi.

Mariner 435
article thumbnail

EEA finds only mixed progress for Europe’s transport sector in meeting environment, climate goals; GHG emissions up 25% since 1990

Green Car Congress

Europe’s transport sector is making only mixed progress in meeting its environment, health and climate policy targets, according to the latest European Environment Agency (EEA) assessment which tracks the short and long-term environmental performance of this key economic sector across the European Union. in 2015 to 7.1%

article thumbnail

Study finds that worldwide SO2 emissions rose between 2000-2005 after decade of decline; China, shipping topped growth

Green Car Congress

Global sulfur dioxide (SO 2 ) emissions peaked in the early 1970s and decreased until 2000, with an increase in recent years due to increased emissions in China, international shipping, and developing countries in general, according to a new analysis appearing in the open access journal Atmospheric Chemistry and Physics. Credit: Smith et al.

2005 186
article thumbnail

PBL/JRC: Global CO2 emissions increase to new all-time record in 2013, but growth is slowing down

Green Car Congress

China started to take new measures to improve energy efficiency and to make a fuel shift away from coal, including coal consumption targets, an increase in hydropower and structural changes. The consumption of oil products increased by 1.7% Biofuel use for transport increased by 7.3% Climate Change Emissions'

2013 240