Remove CO2 Remove Economy Remove Engine Remove MPG
article thumbnail

EPA trends report finds MY 2021 fuel economy remained flat at a record high while CO2 levels hit new low

Green Car Congress

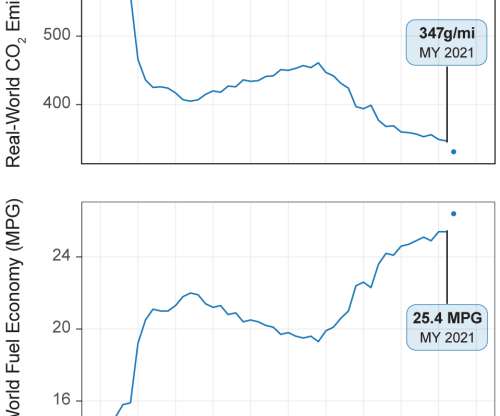
The US Environmental Protection Agency (EPA) released its annual Automotive Trends Report , which shows that model year (MY) 2021 vehicle fuel economy remained at a record high—but flat with MY 2020 fuel economy—while CO 2 emission levels reached a new record low. Estimated real-world fuel economy and CO 2 emissions.

article thumbnail

Tesla had lowest tailpipe CO2 emissions & highest fuel economy in 2021 EPA Auto Trends report finds

Teslarati

Tesla had the lowest tailpipe CO2 emissions for 2021, a new report published by the U.S. The EPA released its annual Automotive Trends report, and findings reveal that Tesla is leading the way with the lowest tailpipe CO2 emissions and the highest fuel economy of all large manufacturers.

article thumbnail

EPA’s annual automotive trends report shows slight increase in fuel economy from MY2017 to MY2018

Green Car Congress

In the US, Model Year (MY) 2018 vehicle fuel economy was 25.1 In model year 2018, the average estimated real-world CO2 emission rate for all new vehicles fell by 4 grams per mile (g/mi) to 353 g/mi, the lowest level measured since 1975, when EPA data collection began. 0 g/mi—and highest fuel economy, at 113.7 Source: EPA.

article thumbnail

EPA annual trends report finds new vehicle fuel economy at record 24.1 mpg; new powertrain technologies rapidly gaining share

Green Car Congress

EPA released the latest edition of its annual report on trends in CO 2 emissions, fuel economy and powertrain technology for new personal vehicles in the US. mpg increase over the previous year and an increase of nearly 5 mpg since 2004. Adjusted fuel economy distribution by model year. Fuel economy. Source: EPA.

article thumbnail

EPA annual report on CO2, fuel economy and technology trends finds 2012 heading for all-time best; rapid adoption of new technologies

Green Car Congress

Adjusted CO 2 emissions and adjusted fuel economy, MY 1975-2011. The report finds that CO 2 emissions rates and fuel economy values reflect a very favorable multi-year trend beginning in MY 2005. The fleet-wide average real world MY 2011 personal vehicle CO 2 emissions value is 398 g/mi and average fuel economy is 22.4

article thumbnail

ICCT: incremental technology can cut vehicle CO2 by half and increase fuel economy >60% through 2030 with ~5% increase in price

Green Car Congress

Starting from a baseline 26 mpg (9.04 l/100 km) in 2016, the The ICCT team assessed increased consumer label fuel economy (as opposed to the regulatory test fuel economy) to 35 mpg (6.71 l/100 km) in 2025 and to 42–46 mpg (5.6-5.11 Starting from a baseline 26 mpg (9.04 l/100 km) in 2025 and to 42–46 mpg (5.6-5.11

article thumbnail

EPA trends report sees record levels of average new vehicle fuel economy and CO2 emissions for MY 2012; role of new gasoline vehicle technologies

Green Car Congress

EPA projects advanced transmissions (6+ speeds and CVTs), gasoline direct injection (GDI) systems, and turbocharged engines will be installed on at least 15% of all MY 2013 vehicles. MY 2012 adjusted fuel economy is 23.6 mpg higher (+5.4%) than MY 2011. mpg, or 22%. Click to enlarge. l/100 km), which is 1.2