article thumbnail

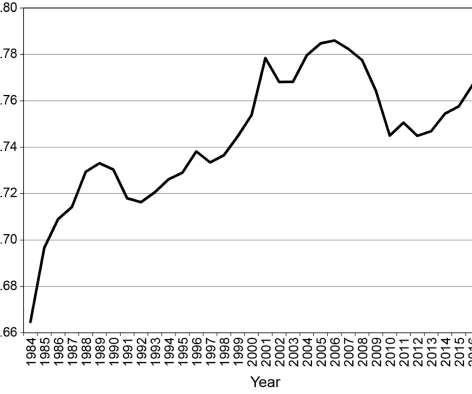
Number of vehicles per person is still down from its maximum in 2006

Green Car Congress

In the previous analysis , I examined the data from 1984 through 2017. The focus in this series is on vehicles per person, as opposed to total number of vehicles (which depends, in part, on the continuously increasing size of the U.S. The main findings (summarized in the table below) are as follows: Vehicles per person increased by 18.2%

2006 293
article thumbnail

Younger persons are still less likely to have a driver’s license than in the 1980s

Green Car Congress

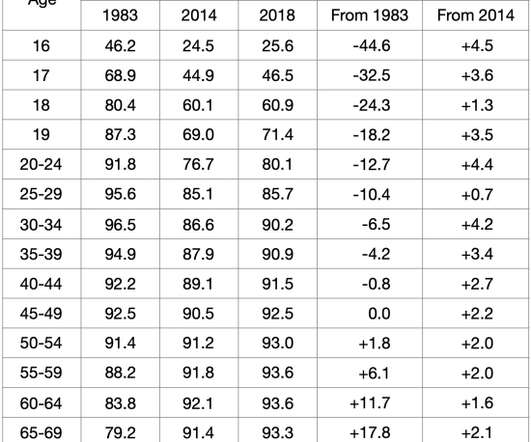
Since 2011 , I have periodically examined changes in the proportion of persons with a driver’s license as a function of age. The previous study compared data for 1983 (as the baseline) with those for 2008, 2011, 2014, and 2017. That was followed by modest increases in the licensure for all age groups between 2014 and 2017.

Personal 293
article thumbnail

More people in the vehicle means less fuel use per person: Comparing SUVs and cars

Green Car Congress

The analysis used the following data for cars and for SUVs: Average real-world vehicle fuel economy for model year 2017 vehicles (based on the information from the Environmental Protection Agency ). Average vehicle occupancy in 2017 for privately operated household vehicles (from Oak Ridge National Laboratory ).

Personal 268
article thumbnail

The majority of vehicle buyers are older than 54

Green Car Congress

In this analysis, I compare the age composition of buyers of new light-duty vehicles (cars and light trucks) in 2007 and 2017. The main findings are as follows: Middle-aged persons purchased proportionally fewer vehicles in 2017 than in 2007 (down from 29% to 14% for those 35 to 44, and from 24% to 20% for those 45 to 54).

2007 418
article thumbnail

Distance driven in the United States: Did we reach the peak in 2004?

Green Car Congress

The focus here is on distance driven per person and per household, as opposed to the absolute distance driven (which depends, in part, on the continuously increasing size of the U.S. The period covered is 1984 through 2017. The chart below shows the distance-driven rates per person and per household. by 2017 (to 8,834 miles).

2004 317
article thumbnail

Number of vehicles in the United States: Did we reach the peak in 2006?

Green Car Congress

In a recent article , I examined changes in distance driven in the United States during the period from 1984 through 2017. Distance driven per person reached a maximum in 2004. While this rate has been on a rebound since 2013, the 2017 rate is still down from 2004 by 5.2%. by 2017 (to 0.769 vehicles). population).

2006 277
article thumbnail

Choosing not to drive: A transient or a permanent phenomenon?

Green Car Congress

(In contrast, the proportion of older persons with a driver’s license increased during the same period.) The first analysis is an update of the licensing trends through 2017. The second analysis provides information related to the degree of permanence of the decrease in licensure of young persons. minus 81.7

2007 295