Remove 2001 Remove Carbon Remove Pollution Remove Transportation
article thumbnail

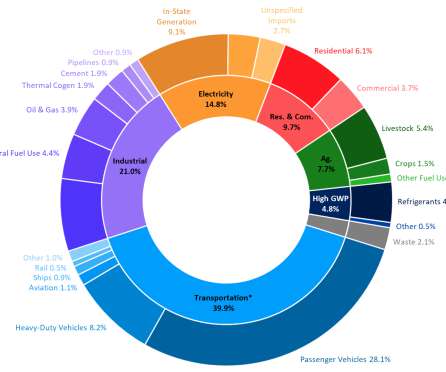
California ARB: GHG emissions fell below 1990 levels for first time in 2016; down 13% from 2004 peak; transportation emissions up 2%

Green Car Congress

The state’s latest Greenhouse Gas Emissions Inventory shows that California emitted 429 million metric tons of climate pollutants in 2016—a drop of 12 million metric tons, or three percent, from 2015. They fell 23% from a peak of 14 metric tons per person (roughly equal to driving 34,000 miles) in 2001 to 10.8

2004 225
article thumbnail

Latest GHG Inventory shows California remains below 2020 emissions target; much steeper rate of GHG reductions required

Green Car Congress

California’s latest greenhouse gas data shows that while the state continues to stay below its 2020 target for emissions, there is much more work to do to achieve carbon neutrality by 2045. Transportation emissions declined 1.5 Per capita GHG emissions in California have dropped from a 2001 peak of 14.0 tons per person to 10.7

2020 221
article thumbnail

Satellite study suggests California clean air regulations working to reduce PM2.5 emissions in state

Green Car Congress

pollution in the state. is especially burdensome in California and accounts for the greatest percentage of health impacts attributable to air pollution. km-resolution MISR aerosol properties over Southern California for years 2001–2003, 2007–2009 and 2013–2015. to predict PM 2.5 Most monitors do not track individual PM 2.5

article thumbnail

Canada publishes proposed regulations for criteria pollutants from locomotives

Green Car Congress

This marks Canada’s first regulation of air pollutant emissions from locomotives. CACs include NO x ; particulate matter (PM); hydrocarbons (HC), carbon monoxide (CO); and sulfur oxides (SO x ). The transportation sector in Canada generated 56.0% Of these amounts, rail transportation was responsible for 11.1% 1973–2001.

Canada 150
article thumbnail

EPA: US greenhouse gases up 2% in 2013; increased coal consumption, cool winter

Green Car Congress

Total US greenhouse emissions were 6,673 million metric tons of carbon dioxide equivalent in 2013, an increase of 2% (127.9 The transportation sector was the second largest sector source, at 27%. By sector, power plants were the largest source of emissions, accounting for 31% of total US greenhouse gas pollution. MMT CO 2 Eq.)

2013 150
article thumbnail

Study Highlights the Importance of Considering Climate Effects of Non-CO2 Emissions from Transport in Mitigation Strategies and Policies

Green Car Congress

The on-road transportation (ORT) and power generation (PG) sectors are major contributors to CO 2 emissions and a host of short-lived radiatively-active air pollutants, including tropospheric ozone and fine aerosol particles, that exert complex influences on global climate. Unger et al. 2009) Click to enlarge. Unger et al. Environ. ,

Climate 150
article thumbnail

Berkeley Lab releases 8th edition of databook on China’s energy and environment; finding the “missing” energy consumption

Green Car Congress

We have gathered statistical information on energy and energy demand drivers from all different resources, such as the China Environment Yearbook , the Transportation Yearbook , the Power Yearbook , the Iron and Steel Yearbook , the Cement Almanac , statistics of oil companies and power companies. The first four editions were paper-based.