Remove 2000 Remove Coal Remove Renewable Remove Wind
article thumbnail

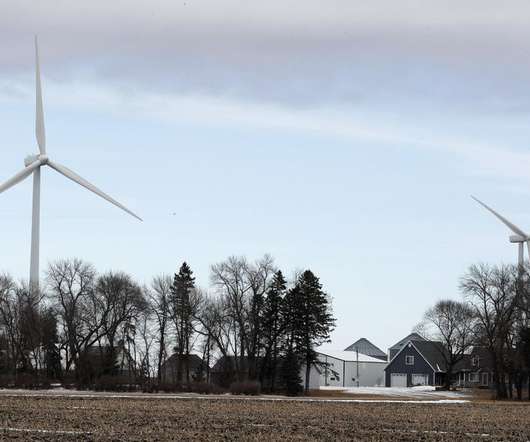
USA & China Electricity Generation TWh & CO2e Trajectories Since 2000 Are Startling

CleanTechnica EVs

For a decade I’ve been tracking the exponential expansion of wind, solar, and to a lesser extent hydro electricity generation. continued] The post USA & China Electricity Generation TWh & CO2e Trajectories Since 2000 Are Startling appeared first on CleanTechnica.

2000 93
article thumbnail

Udokan Copper to cut carbon intensity of copper production up to 75% by 2035

Green Car Congress

The company’s plan to decrease carbon emissions involves the possibility of purchasing low-emissions electricity from power sources such as hydro, wind and solar, as well as its own power generation from renewable sources. Chechetkin, VS & Yurgenson, Georgi & Narkelyun, LF & Trubachev, AI & Salikhov, VS. (2000). 733-745.

Carbon 273
article thumbnail

BP Statistical Review finds global oil share down for 12th year in a row, coal share up to highest level since 1969; renewables at 2%

Green Car Congress

Oil demand grew by less than 1%—the slowest rate amongst fossil fuels—while gas grew by 2.2%, and coal was the only fossil fuel with above average annual consumption growth at 5.4% Fossil fuels still dominated energy consumption with 87% market share, while renewables rose fastest but are still only 2% of the global total.

Coal 261
article thumbnail

EIA: US energy-related CO2 dropped 2.7% in 2015; of end-use sectors, only transportation increased

Green Car Congress

Specific circumstances, such as the very warm fourth quarter of 2015 and relatively low natural gas prices, put downward pressure on emissions as natural gas was substituted for coal in electricity generation. Coal’s share of total electricity generation in the power sector fell from 54% in 1990 to 34% in 2015.

2015 150
article thumbnail

Berkeley Lab releases 8th edition of databook on China’s energy and environment; finding the “missing” energy consumption

Green Car Congress

They used a lot more coal than they originally admitted to, several hundred million tons more. Like many other people, we were writing articles around 2000 about the decline in China’s energy consumption in the late 1990s. Like the United States, China has become among the world’s largest importers of oil, gas and coal.

article thumbnail

Global CO2 emissions up 3% in 2011; per capita CO2 emissions in China reach EU levels

Green Car Congress

Some of the findings of the report include: Global consumption of coal (responsible for about 40% total CO 2 emissions) grew in 2011 by 5%, whereas global consumption of natural gas and oil products increased by only 2% and 1%, respectively. Coal consumption in China increased by 9.7% Japan (4%). of all energy.

2011 236
article thumbnail

DOE Awarding $620M for Smart Grid Demonstration and Energy Storage Projects

Green Car Congress

Improved energy storage technologies will allow for expanded integration of renewable energy resources like wind and photovoltaic systems and will improve frequency regulation and peak energy management. Tehachapi Wind Energy Storage Project. DOE funding $75,161,246, total project value with cost share $150,322,492). 29,561,142.