Remove Economy Remove Electric Remove MPG Remove Vehicles
article thumbnail

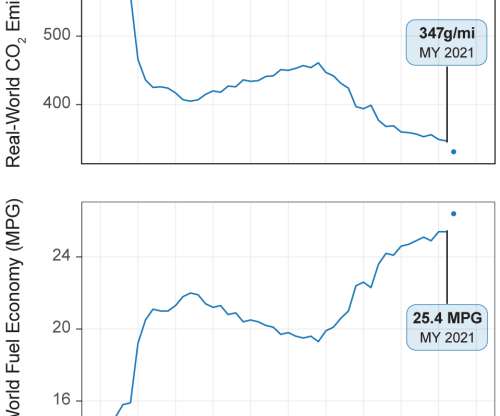
Actual fuel economy of cars and light trucks: 1966-2019

Green Car Congress

vehicle fuel economy. Specifically, this study examines actual fuel economy of cars and light trucks (pickup trucks, SUVs, and vans) from 1966 through 2019. (My Calculated vehicle fuel economy is available going back to 1923. The graph below shows the changes in actual vehicle fuel economy from 1966 through 2019.

article thumbnail

Actual fuel economy of cars and light trucks: 1966-2017

Green Car Congress

vehicle fuel economy. Specifically, this study examines actual fuel economy of cars and light trucks (pickup trucks, SUVs, and vans) from 1966 through 2017. Calculated vehicle fuel economy is available going back to 1923. The graph below shows the changes in actual vehicle fuel economy from 1966 through 2017.

article thumbnail

U.S. regulator launches loosened fuel economy standards

Teslarati

safety regulator has officially launched more relaxed fuel economy standards, following a similar move from the Environmental Protection Agency (EPA) made a few months ago. The National Highway Traffic Safety Administration (NHTSA) has officially announced new fuel standards requiring an average fleet fuel economy of 50.4 The top U.S.

article thumbnail

EPA trends report finds MY 2021 fuel economy remained flat at a record high while CO2 levels hit new low

Green Car Congress

The US Environmental Protection Agency (EPA) released its annual Automotive Trends Report , which shows that model year (MY) 2021 vehicle fuel economy remained at a record high—but flat with MY 2020 fuel economy—while CO 2 emission levels reached a new record low. Estimated real-world fuel economy and CO 2 emissions.

article thumbnail

EPA annual trends report finds new vehicle fuel economy at record 24.1 mpg; new powertrain technologies rapidly gaining share

Green Car Congress

EPA released the latest edition of its annual report on trends in CO 2 emissions, fuel economy and powertrain technology for new personal vehicles in the US. Among the top-level findings was that Model year 2013 vehicles achieved an average of 24.1 mpg increase over the previous year and an increase of nearly 5 mpg since 2004.

article thumbnail

EPA’s annual automotive trends report shows slight increase in fuel economy from MY2017 to MY2018

Green Car Congress

In the US, Model Year (MY) 2018 vehicle fuel economy was 25.1 In model year 2018, the average estimated real-world CO2 emission rate for all new vehicles fell by 4 grams per mile (g/mi) to 353 g/mi, the lowest level measured since 1975, when EPA data collection began. 0 g/mi—and highest fuel economy, at 113.7

article thumbnail

EIA: fuel economy improvements bring diminishing returns in fuel savings

Green Car Congress

Improving fuel economy exhibits diminishing returns in fuel savings, according to a brief analysis by the US Energy Information Administration (EIA). Similarly, the fuel and cost savings of improving fuel economy from 12 mpg to 15 mpg are the same as increasing from 30 mpg to 60 mpg.