article thumbnail

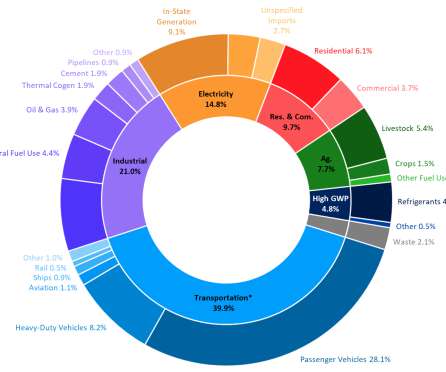
California 2017 GHG inventory shows 1.2% total drop from 2016; transportation sector emissions up 1%

Green Car Congress

In 2017, emissions from GHG emitting activities statewide were 424 million metric tons of CO 2 equivalent (MMTCO 2 e), 5 MMTCO 2 e lower than 2016 levels and 7 MMTCO 2 e below the 2020 GHG Limit of 431 MMTCO 2 e. Compared to 2016, California’s GDP grew 3.6% while the carbon intensity of its economy declined by 4.5%.

2017 230
article thumbnail

Latest GHG Inventory shows California remains below 2020 emissions target; much steeper rate of GHG reductions required

Green Car Congress

California statewide GHG emissions dropped below the 2020 GHG Limit in 2016 and have remained below the 2020 GHG Limit since then. in 2018 (2000-2018 average year-over-year increase is 6.8%), continuing the increasing trend as they replace Ozone Depleting Substances (ODS) being phased out under the 1987 Montreal Protocol.

2020 221
article thumbnail

Emissions of potent GHG HFC-23 have grown, contradicting reports of huge reductions

Green Car Congress

This would have been a big win for climate. That the reduction has not materialized—and that global emissions have instead risen—is a puzzle, and may have implications for the Montreal Protocol, the international treaty that was designed to protect the stratospheric ozone layer. —co-author Dr Matt Rigby.

Emissions 199
article thumbnail

WMO reports GHG concentrations at highest in 800K years

Green Car Congress

Concentrations of carbon dioxide in the atmosphere surged at a record-breaking speed in 2016 to the highest level in 800,000 years, according to the World Meteorological Organization’s Greenhouse Gas Bulletin. parts per million in 2016, up from 400.00 parts per million in 2016, up from 400.00 ppm in 2015.

2016 186
article thumbnail

EPA proposes new rules to reduce global warming HFC emissions from refrigerants

Green Car Congress

Specifically, the proposed rule updates the current prohibition under section 608 of the Clean Air Act against knowingly venting, releasing or disposing of ozone-depleting (ODS) and substitute refrigerants and extends the requirements, as appropriate, to non-ozone-depleting substitute refrigerants, such as hydrofluorocarbons (HFCs).

EPA 150
article thumbnail

MIT study finds air quality co-benefits of US carbon policies can significantly offset costs, depending upon the policy

Green Car Congress

Air quality co-benefits are additional to climate benefits realized from reduced CO 2 emissions.). In a paper published in the journal Nature Climate Science , the MIT researchers took a systems-level approach to analyzing how climate policies influence air quality, focusing on US emissions of O 3 and PM 2.5

MIT 231
article thumbnail

UMD-led study finds China’s SO2 emissions down 75% since 2007, India’s up 50%; India may now be the top SO2 emitter

Green Car Congress

Two maps compare total annual sulfur dioxide amounts for India and China during 2005 (left) and 2016 based on Ozone Monitoring Instrument measurements. Illustration: Chris McLinden, Environment and Climate Change Canada. Purple depicts the highest concentrations while white depicts the lowest. Click to enlarge.

India 170