Remove 2005 Remove Coal Remove Diesel Remove Gasoline-Electric
article thumbnail

EPA GHG Inventory shows US GHG down 1.7% y-o-y in 2019, down 13% from 2005

Green Car Congress

This decrease was driven largely by a decrease in emissions from fossil fuel combustion resulting from a decrease in total energy use in 2019 compared to 2018 and a continued shift from coal to natural gas and renewables in the electric power sector. CO 2 emissions decreased 2.2% from 2018 to 2019. over the same period. Source; EPA.

2005 418
article thumbnail

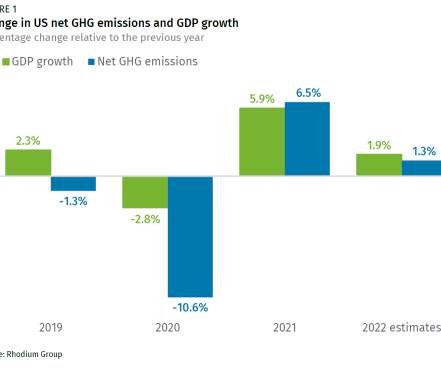
Rhodium Group estimates US GHG emissions rose 1.3% in 2022

Green Car Congress

This reversal in 2022 was largely due to the substitution of coal with natural gas—a less carbon-intensive fuel—and a rise in renewable energy generation. In the first quarter of 2022, fuel demand in the transportation sector, including gasoline, jet fuel, and diesel, rose slightly. below 2005 levels.

Emissions 273
article thumbnail

EPA: US GHG fell 0.5% y-o-y in 2017; power sector down by 4.2%, transportation up 1.21%

Green Car Congress

This decrease was largely driven by a decrease in emissions from fossil fuel combustion, which was a result of multiple factors including a continued shift from coal to natural gas and increased use of renewables in the electric power sector, and milder weather that contributed to less overall electricity use.

2017 199
article thumbnail

EPA: US GHG emissions in 2017 down 0.3% from 2016

Green Car Congress

The decrease in CO 2 emissions from fossil fuel combustion was a result of multiple factors, including a continued shift from coal to natural gas, increased use of renewables in the electric power sector, and milder weather that contributed to less overall electricity use. below 2005 levels. above 1990 levels in 2007.

2017 262
article thumbnail

EPA: US greenhouse gases dropped 3.4% in 2012 from 2011; down 10% from 2005 levels

Green Car Congress

According to the report, GHG emissions in 2012 showed a 10% drop below 2005 levels, and were only slightly above the emissions in 1994 (6,520 million metric tons). CO 2 emissions are produced by the electricity generation sector as they consume fossil fuel to provide electricity to one of the other four end-use sectors.

2005 252
article thumbnail

EIA: US energy-related CO2 dropped 2.7% in 2015; of end-use sectors, only transportation increased

Green Car Congress

Energy-related CO 2 emissions in 2015 were about 12% below 2005 levels. Specific circumstances, such as the very warm fourth quarter of 2015 and relatively low natural gas prices, put downward pressure on emissions as natural gas was substituted for coal in electricity generation. Electricity. from 2014 levels.

2015 150
article thumbnail

EIA: US energy-related CO2 emissions down 1.7% in 2016; carbon intensity of economy down 3.1%; transportation emissions up

Green Car Congress

Emissions have declined in 6 out of the past 10 years, and energy‐related CO 2 emissions in 2016 were 823 MMmt (14%) below 2005 levels, according to the EIA. Among the findings of the EIA analysis: CO 2 emissions form natural gas surpassed those from coal in 2016. Transportation increase led by gasoline consumption.

2016 150