Remove 2000 Remove Climate Change Remove Gasoline-Electric Remove Products
article thumbnail

PSI team develops web tool for consumers to compare environmental impact of passenger cars in detail

Green Car Congress

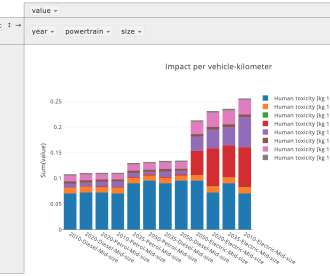
The system will graph lifecycle impact for a range of specified powertrains, for a large number of impact categories: Climate change [kg CO 2 -eq.]. The top sample above shows climate change impact; the subsequent chart shows human toxicity. Sample results from Carculator. Depletion of fresh water reserves [m 3 ].

Mariner 435
article thumbnail

UK auto industry warns anti-diesel agenda and slow uptake of EVs could mean missing 2021 CO2 targets; rising CO2 average in 2017

Green Car Congress

The UK automotive industry warned that the current anti-diesel agenda combined with the ongoing slow take-up of electric vehicles could mean industry misses its next round of CO 2 targets in 2021, with negative consequences for the UK’s own climate change goals. However, this increase was not enough to offset a -17.1%

2017 210
article thumbnail

California 2017 GHG inventory shows 1.2% total drop from 2016; transportation sector emissions up 1%

Green Car Congress

Changes in emissions by Scoping Plan sector between 2000 and 2017. It does not include emissions from petroleum refineries and oil production. Emissions from gasoline used in on-road vehicles are the main driver of that increase. In-State Hydro, Solar, and Wind Electricity Generation. Source: ARB. Source: ARB.

2017 230
article thumbnail

Study concludes abundant shale gas is neither climate hero nor villain; need for targeted GHG reduction policy

Green Car Congress

Advances in technologies for extracting oil and gas from shale formations have dramatically increased production in the United States. Shale gas in particular has grown rapidly, from less than one percent of US production in 2000 to 34% in 2012, and projections show strong production growth continuing for the foreseeable future.

Climate 199
article thumbnail

EIA: US energy-related CO2 dropped 2.7% in 2015; of end-use sectors, only transportation increased

Green Car Congress

This decline occurred despite growth in real gross domestic product (GDP) of 2.6% Specific circumstances, such as the very warm fourth quarter of 2015 and relatively low natural gas prices, put downward pressure on emissions as natural gas was substituted for coal in electricity generation. Electricity. from 5,405 MMmt in 2014.

2015 150
article thumbnail

US EIA Reports Record-setting 7% Overall Decline in US Carbon Dioxide Emissions in 2009; Transport Emissions Down 4.1%, Lowest Percentage Reduction of the End-UseSectors

Green Car Congress

In addition to a decline in gross domestic product (GDP) in 2009 of 2.4%, the energy intensity of the economy (energy consumed per dollar of GDP) declined 2.4% Carbon intensity changes in the electric power and industrial end use sectors. The average decline in energy intensity from 2000 to 2008 was 2.0%. Source: EIA.

2009 239
article thumbnail

False Starts: The Story of Vehicle-to-Grid Power

Cars That Think

They wanted to see whether an electric vehicle could feed electricity back to the grid. The concept behind V2G had gained traction in the late 1990s after California’s landmark zero-emission-vehicle (ZEV) mandate went into effect and compelled automakers to commercialize electric cars. AC Propulsion’s experiment was timely.

Grid 127