article thumbnail

TOAR shows present-day global ozone distribution and trends relevant to health; public database

Green Car Congress

Ozone levels across much of North America and Europe dropped significantly between 2000 and 2014. People living in parts of southern Europe, South Korea and southern Japan and China also experienced more than 15 days a year of ozone levels above 70 ppb. Source: University of Leicester. Click to enlarge.

Ozone 255
article thumbnail

Study finds rising temperatures increase risk of unhealthy ozone levels absent sharp cuts in precursors

Green Car Congress

Ozone pollution across the continental United States will become far more difficult to keep in check as temperatures rise, according to new work led by the National Center for Atmospheric Research (NCAR). Ozone formation. Even short periods of unhealthy ozone levels can cause local death rates to rise. Scenario A2 and RCP 8.5.

Ozone 199
article thumbnail

MIT study says combustion emissions cause ~200,000 premature deaths/year in US; vehicles and power generation top sources

Green Car Congress

Annual average concentrations of fine particulates from US sources of combustion emissions from (a) electric power generation; (b) industry; (c) commercial and residential sources; (d) road transportation; (e) marine transportation; (f) rail transportation; (g) sum of all combustion sources; (h) all sources. Source: MIT. Click to enlarge.

MIT 378
article thumbnail

UN report projects that increasing use of HFCs likely to have a significant climate impact by 2050; equivalent to current total annual emissions from transport

Green Car Congress

The decrease in CO 2 equivalent emissions of ODSs (ozone-depleting substances: CFCs, halons, HCFCs, and others) may be offset by the projected increase in their non-ozone depleting substitutes (HFCs) (lines designated as HFC scenarios). W m -2 relative to 2000. Climate and the Ozone Layer. Source: UNEP. Click to enlarge.

Climate 287
article thumbnail

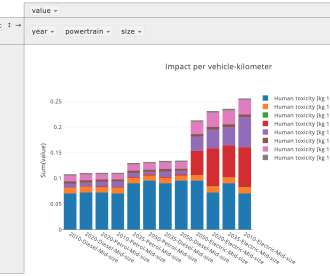
PSI team develops web tool for consumers to compare environmental impact of passenger cars in detail

Green Car Congress

Deterioration of the ozone layer [kg CFC-11-eq.]. The program guides the interested layperson through a selection of parameters: which type of engine should be used, gasoline-burning or diesel, for example, or one powered by natural gas, a fuel cell, or a battery. Depletion of fossil energy resources [kg oil-eq.].

Mariner 435
article thumbnail

California 2017 GHG inventory shows 1.2% total drop from 2016; transportation sector emissions up 1%

Green Car Congress

Changes in emissions by Scoping Plan sector between 2000 and 2017. Electricity generated by California’s in-state wind power projects, large commercial-scale solar power projects, rooftop solar panels, and hydropower generation stations. Compared to 2016, California’s GDP grew 3.6% Trends in California GHG Emissions.

2017 230
article thumbnail

Study Finds On-Road Transportation Sector the Greatest Net Contributor to Atmospheric Warming Now and in Mid-Term; Power Sector Takes the Lead by 2050

Green Car Congress

Radiative forcing due to perpetual constant year 2000 emissions grouped by sector for 2020 (left) and 2100 (right) showing the contribution from each species. Nadine Unger By 2050, electric power generation overtakes road transportation as the biggest promoter of warming, according to the study. From Unger et al., Click to enlarge.