Remove 2000 Remove Environment Remove Ozone Remove Transportation
article thumbnail

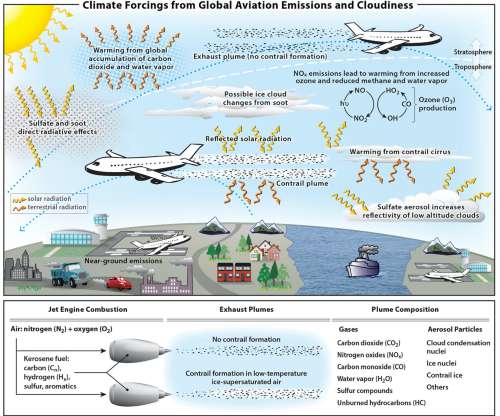
Study: 2/3 of aviation climate impact due to emissions other than CO2

Green Car Congress

The study was published in the journal Atmospheric Environment. Net warming from NO x emissions is a sum over warming (short-term ozone increase) and cooling (decreases in methane and stratospheric water vapor, and a long-term decrease in ozone) terms. Aviation accounts for 3.5% Pitari, M.J. Prather, R. Sausen, L.J.

Climate 448
article thumbnail

Study finds rising temperatures increase risk of unhealthy ozone levels absent sharp cuts in precursors

Green Car Congress

Ozone pollution across the continental United States will become far more difficult to keep in check as temperatures rise, according to new work led by the National Center for Atmospheric Research (NCAR). Ozone formation. Even short periods of unhealthy ozone levels can cause local death rates to rise. Scenario A2 and RCP 8.5.

Ozone 199
article thumbnail

PSI team develops web tool for consumers to compare environmental impact of passenger cars in detail

Green Car Congress

Deterioration of the ozone layer [kg CFC-11-eq.]. Eutrophication of non-marine aquatic environments [kg N-eq.]. Eutrophication of non-marine aquatic environments [kg P-eq.]. Land occupation in an urban environment [m 2 / year]. Toxicity of marine aquatic environments [kg 1,4-DC-eq.]. Human toxicity [kg 1,4-DC-eq.].

Mariner 435
article thumbnail

Latest GHG Inventory shows California remains below 2020 emissions target; much steeper rate of GHG reductions required

Green Car Congress

The data shows a slight increase in overall emissions from the previous year, and a slight decline in emissions from transportation, which is the state’s main source of both GHGs and air pollutants. Transportation emissions declined 1.5 Source: California Air Resources Board (ARB). tons per person to 10.7

2020 221
article thumbnail

MIT study says combustion emissions cause ~200,000 premature deaths/year in US; vehicles and power generation top sources

Green Car Congress

Annual average concentrations of fine particulates from US sources of combustion emissions from (a) electric power generation; (b) industry; (c) commercial and residential sources; (d) road transportation; (e) marine transportation; (f) rail transportation; (g) sum of all combustion sources; (h) all sources. Source: MIT.

MIT 378
article thumbnail

UN report projects that increasing use of HFCs likely to have a significant climate impact by 2050; equivalent to current total annual emissions from transport

Green Car Congress

The decrease in CO 2 equivalent emissions of ODSs (ozone-depleting substances: CFCs, halons, HCFCs, and others) may be offset by the projected increase in their non-ozone depleting substitutes (HFCs) (lines designated as HFC scenarios). W m -2 relative to 2000. Climate and the Ozone Layer. Source: UNEP. Click to enlarge.

Climate 287
article thumbnail

EEA report finds most Europeans in cities still exposed to levels of air pollution exceeding WHO guidelines

Green Car Congress

The European Environment Agency’s (EEA’s) “ Air quality in Europe — 2019 report ” shows that almost all Europeans living in cities are still exposed to air pollution levels that exceed the health-based air quality guidelines (AQGs) set by the World Health Organization (WHO). About 8% of the urban population in the EU-28 was exposed to PM 2.5

Pollution 170