Remove 2004 Remove Climate Change Remove EPA Remove Gas
article thumbnail

EPA: US GHG emissions up 6% in 2021 from 2020

Green Car Congress

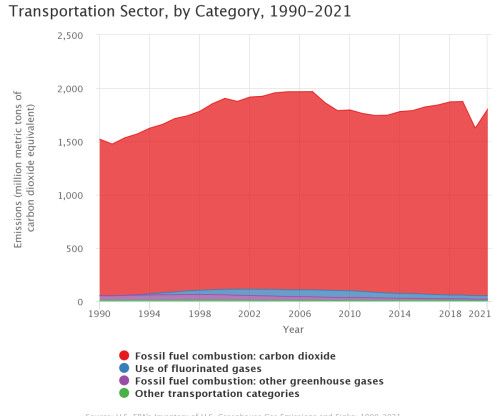
The US Environmental Protection Agency (EPA) released its 30 th annual Inventory of US Greenhouse Gas Emissions and Sinks (GHG Inventory), which presents a national-level overview of annual greenhouse gas emissions from 1990 to 2021. In 2021, US greenhouse gas emissions totaled 6,340.2 Source: EPA.

EPA 259
article thumbnail

EPA: US GHG fell 0.5% y-o-y in 2017; power sector down by 4.2%, transportation up 1.21%

Green Car Congress

Year-over-year, US greenhouse gas emissions were 0.5% lower in 2017 than the prior year (after accounting for sequestration from the land sector), and power sector emissions fell 4.2%, according to the 2019 edition of the US Environmental Protection Agency’s (EPA) annual report on greenhouse gas (GHG) emissions.

2017 199
article thumbnail

EPA: US greenhouse gases dropped 3.4% in 2012 from 2011; down 10% from 2005 levels

Green Car Congress

US greenhouse gas emissions by gas. Source: EPA. The US Environmental Protection Agency (EPA) released its 19 th annual report of overall US greenhouse gas (GHG) emissions, showing a 3.4% Annual US greenhouse gas emissions relative to 1990 (1990=0). Source: EPA. Source: EPA. Click to enlarge.

2005 252
article thumbnail

EPA: US greenhouse gases up 2% in 2013; increased coal consumption, cool winter

Green Car Congress

Source: EPA. over the prior year, according to the EPA’s newly published Inventory of US Greenhouse Gas Emissions and Sinks: 1990–2013. By sector, power plants were the largest source of emissions, accounting for 31% of total US greenhouse gas pollution. Source: EPA. US GHG emissions by sector, 1990-2013.

2013 150
article thumbnail

UCR study finds ultra-low emission natural gas bus exceeds federal and state NOx standards; as low as 0.0007g/bhp-hr

Green Car Congress

A study by the University of California, Riverside College of Engineering Center for Environmental Research and Technology (CE-CERT) found that a Los Angeles County Metropolitan Transit Agency (Metro) bus equipped with an ultra-low emission natural gas engine performs significantly cleaner than its certification standards across all duty cycles.

Standards 199
article thumbnail

EPA’s annual automotive trends report shows slight increase in fuel economy from MY2017 to MY2018

Green Car Congress

miles per gallon MY 2017, according to the annual Automotive Trends Report released by the US Environmental Protection Agency (EPA). In model year 2018, the average estimated real-world CO2 emission rate for all new vehicles fell by 4 grams per mile (g/mi) to 353 g/mi, the lowest level measured since 1975, when EPA data collection began.

article thumbnail

EPA: US Greenhouse Gas Emissions Rose 1.4% in 2007

Green Car Congress

The US Environmental Protection Agency (EPA) has released the national greenhouse gas inventory, which finds that overall emissions during 2007 increased by 1.4% Tg in 2004, and since then have declined about 3%. 2009 US Greenhouse Gas Inventory Report. from the previous year. percent from 1990 to 2007. Tg) from 1990.

2007 150